During the last three months the whole planet is caught in the turmoil of the Corona pandemic. In the news we are constantly overwhelmed with facts and findings concerning the SARS-CoV-2 virus. As a mankind we were all, and still are, astonished by how this virus spreads all over the world and in a rather short time becoming a global issue. In particular, notion of the mysterious appears in much of the media.
While it is not at all obvious what this quantity measures exactly, it is obvious that making it smaller than 1 really is crucial in controlling the spread of the virus. So what is this really? Here we make an attempt at explaining this in the easiest possible way.
As a result of the size of the COVID-19 pandemic, governments have taken drastic measures to halt the spread of the virus above critical levels. This is called “flattening of the curve”, and should smoothen out the peak on the health care system. Teams of experts are working frantically in designing appropriate policies, increasing awareness, monitoring the spread of the virus and trying to develop vaccines and medicines against the virus. In the end, abiding to some simple rules, like social distancing, seems to be a very efficient measure to decrease the spread of this, and actually, any virus.
Making smaller than 1 is crucial in controlling the spread of the virus.
Besides these measures it is important to realize that herd immunity might in the end help us further. Herd immunity means that people who have not yet obtained the disease are effectively shielded from becoming infected by all the immune people around them, who will not spread the disease. Indeed, during the epidemic a sufficient amount of individuals will eventually become immune, which means that they have been infected, recovered and have developed antibodies against the virus.
Therefore, they help avoid an after-shock until the crucial moment that a vaccine is finally developed. It is important to note that herd immunity is not an objective in itself when policies are made but a beneficial result of the fact that people recover. For how long recovered patients are immune against a new infection from the Corona virus is however not entirely clear yet.
This collective immunity, which works as a shield for those not infected by cutting possible transmission routes of the virus in the population, is called herd immunity since susceptible people will be protected by a herd of people who have become immune. The estimate is that the percentage of people who are immune needs to be around 60% to effectively stop the disease from spreading, not just for COVID-19, but also for a disease such as the measles.
The question now is, how can all this be quantified?
In this article we focus on the question how the virus spread so fast and all over the world. Furthermore we discuss how measures like social distancing help to slow down the virus spread. Although this is a question that seems to primarily concern the past period since the virus has already spread around, answering these two questions can still help us to understand exactly how we should go back to our normal way of life after the crisis is over. Because designing such an “exit-scenario” is a hugely complex endeavor, the same simple rules discussed above will again play a key role.
The answer to both questions raised above lies in understanding some facts about the Basic Reproduction Number, usually denoted by , and the Effective Reproduction Number, denoted by . These are highly delicate objects to properly define, and they are central in epidemiology.
In a nutshell, an epidemic spreads in a population when , while it dies out when .
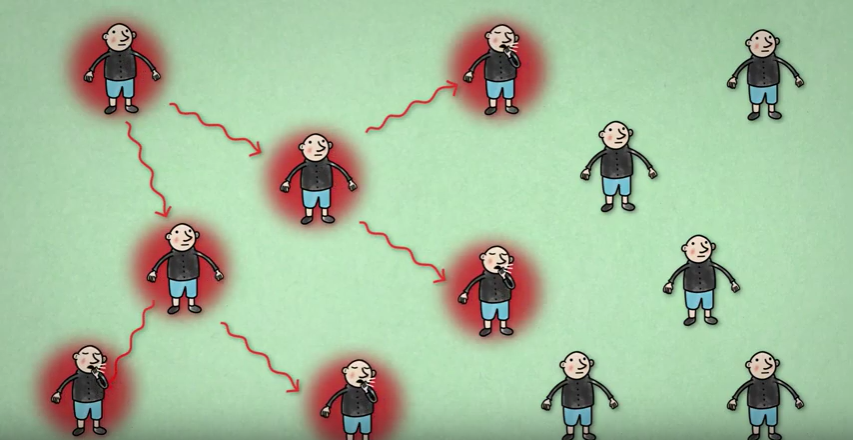
If then each infected individual will infect on average two other individuals. This picture is part of a video made by Bruno van Wayenburg.
In words, measures the average number of additional infections per infected person in a population living under its normal circumstances where no additional measures, like vaccination, social distancing or home isolation, are implemented. It is important to mention that may vary for the same virus in different populations. For the case of COVID-19 this is explained nicely in this video.
In order to quantify the effect that measures have on the spread of a virus we use instead of , and can change as measures are implemented, as more people become immune, etc. The Effective Reproduction Number thus quantifies the effectiveness of additional measures and varies in time. We can think about it in the following way: When a virus enters a population we have that . Afterwards measures are being implemented which aim at decreasing after some time. Hence measures the average number of additional infections per infected person at this moment of time after measures have been implemented.
Measures like social distancing can lower the value of , thus effectively halting the spread of the epidemic. Let’s have a closer look into how is defined.
The Reproduction Number
In epidemiology, the basic reproduction number of an infection, denoted and pronounced “ naught” or “ zero”, can be thought of as the expected number of cases directly generated by one case in a population where all individuals are susceptible to infection. is not a biological constant for a virus, as it is also affected by other factors such as environmental conditions and the behavior of the infected population. For example, in a very densely populated region will be higher compared to a population that is less densely populated. The most important use of lies in determining whether an emerging infectious disease can spread in a population and go viral’</em> or <em>pandemic’. For this, one needs to determine what proportion of the population should be immunized through vaccination to eradicate a disease.
In commonly used infection models, when the infection will be able to start spreading in a population, but not if . Generally, the larger the value of , the harder it is to effectively control the epidemic.
The basic reproduction number is affected by several factors including the duration of infectivity of affected patients, the infectiousness of the virus, and the number of susceptible people in the population that the affected patients are in contact with.
We start by explaining the role of in the simplest possible scenario. Suppose that . Then every infected person infects other people. Thus, one initial case will infect other cases, who will infect further cases, who will infect more cases, who will infect another cases, etc. The number of infected will then grow as follows:
This is called exponential growth. You can see that this grows like crazy, and the pandemic is very hard to control and maintain. In the figure on the right we also plot these numbers to see how they grow. Of course, eventually the spread will have to slow down, because after more than steps, there are more infected people than inhabitants in the Netherlands. But with an of , a huge part of the population will quickly receive the disease, and thus many deaths will follow. Thus, it is of crucial importance to limit the average number of additional infections per infected person.
Above we have assumed that one knows what really is. However, the world is unfortunately not so simple. Although seemingly simple, is a very delicate concept and is usually estimated from rather complex mathematical models that depend on estimations and the context in which an epidemic takes place. Thus, one needs to carefully take the data of the number of infected, the number of people in hospitals, etc. into account to be able to reliably estimate what is. Let us explain how this is done by our own RIVM (The Dutch Institute for Public Health).
Following a report of the RIVM we can see a simple way to relate in terms of three factors. The first factor is denoted by , and represents the average number of days that an individual stays infectious. Further, the second factor represents the average number of contacts that an individual has per day, where represents the fraction of the population that is susceptible to the virus. Finally, the factor represents the probability of infection when an infected individual comes in contact with a healthy susceptible individual. Using this information, we obtain the formula
We see that a high is a complex mix of various parameters that are in general rather hard to estimate. For a virus we have limited power in affecting or , these depend on the nature of the virus itself. For policy makers, it is crucial to note that
the factor depends purely on human behavior that we can influence by appropriate restrictions.
Thus, controlling the spread of SARS-CoV-2 boils down to limiting , and thus enforcing travel restrictions, social distancing, etc. At this point starts differentiating from , from the moment we start implementing measures to reduce we speak of an effective reproduction number which is defined similarly as but with a varying .
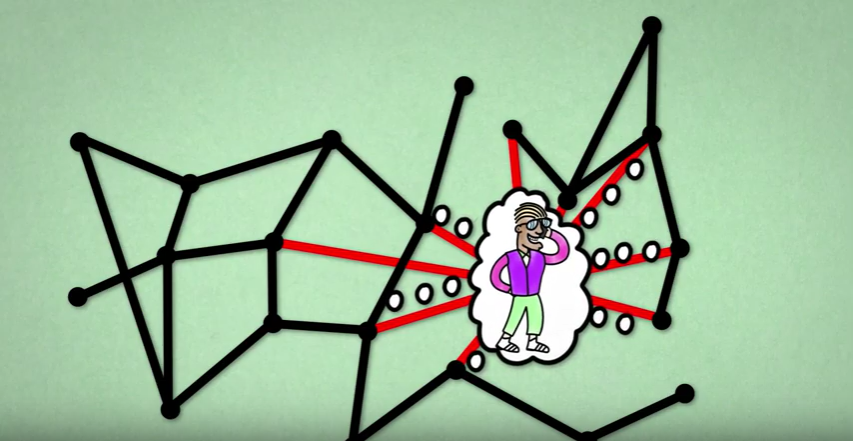
Individuals with a lot of contacts, hence high may also infect a lot of other individuals. This picture is taken from a video made by Bruno van Wayenburg.
What do we know about these factors for the case of SARS-CoV-2? According to the European Centre for Disease Prevention and Control (ECDC) the factor is estimated to be between 3 and 10 days. According to the WHO it can even climb to up to 14 days. For the SARS-CoV-2 virus the basic reproduction number has been estimated to be between and when no measures are in effect. The ECDC estimated it to be equal to . This means that without any measures to prevent spreading of the virus it will spread like wildfire in the population, as we have seen happening in the initial stages of the pandemic. Thus, controlling remains to be of vital importance.
During our teenage years, everything changes. It’s no surprise that our brain does too. But how do we make sense of this transformation? Is there a way to quantify it? Networks might just be the answer.
Despite our level of development, the pandemic has been continuously causing us struggles for two years. This gives rise to an obvious question: How can contemporary science not deal with a flu-like virus?
Rafael Prieto-Curiel is a mathematician and a faculty member at the Complexity Science Hub in Vienna, Austria. His research focuses on crime, mobility, migration and urban dynamics. We interviewed Rafael to learn about his story.
 appears in much of the media.
 smaller than 1 is crucial in controlling the spread of the virus.
 , while it dies out when
  .
.
 then each infected individual will infect on average two other individuals. This picture is part of a video made by Bruno van Wayenburg.
 . Afterwards measures are being implemented which aim at decreasing
  the infection will be able to start spreading in a population, but not if
  . Generally, the larger the value of
  other people. Thus, one initial case will infect
  further cases, who will infect
  more cases, who will infect another
  cases, etc. The number of infected will then grow as follows:
 steps, there are more infected people than inhabitants in the Netherlands. But with an
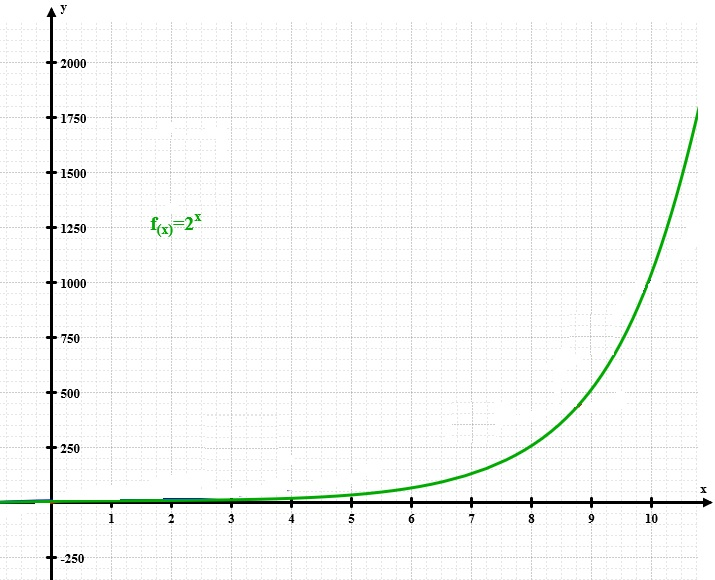
 , and
, and  represents the average number of contacts that an individual has per day, where
  represents the fraction of the population that is susceptible to the virus. Finally, the factor
  represents the probability of infection when an infected individual comes in contact with a healthy susceptible individual. Using this information, we obtain the formula
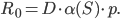
 and
and  when no measures are in effect. The ECDC estimated it to be equal to
  . This means that without any measures to prevent spreading of the virus it will spread like wildfire in the population, as we have seen happening in the initial stages of the pandemic. Thus, controlling