Living in the 21st century, we are constantly exposed to outstanding scientific discoveries. Starting with advanced appliances such as dishwashers and mobile phones that have revolutionised our houses and communication style, through new medical treatments like gene therapies, so innovative that they make us believe immortality might be within our reach one day, to unbelievably smart artificial intelligence responsible for constructing robots that are slowly starting to outsmart its creators.
However, the emergence of the COVID-19 pandemic seems to have declined our belief in the power of science. And there are good reasons for this. Despite our high level of development, the pandemic has been continuously causing us struggles for two years. This gives rise to a very obvious question: How can contemporary science not deal with a flu-like virus?
The issue is, up to 2020, the study of epidemiology was somewhat neglected. Tom Britton, a Swedish professor who had been working in the field of epidemiological modelling for more than 20 years now, once mentioned that before the COVID outbreak, he was usually invited to give a few research talks per year; after the outbreak, this number surpassed a hundred; This relatively low popularity of epidemiological modelling limited the speed of its development and led to the situation, in which the well worked out methods certified for a broader use were simply slightly outdated. What does that mean? To understand that we first need to delve into the very root of epidemiological modelling: probability theory.
Probability theory is a very rapidly growing field of mathematics that enables dealing with processes that are uncertain, yet some predictions about them are possible. For instance, a dice throw: when we throw a dice, we have no idea what number will show up, but we know it has to be something between 1 and 6 and if we assume our dice is fair, all these numbers are equally likely.
Of course, in reality, one could argue it is not completely true and the experiment is not actually random: the number we roll is a result of the amount of power we use, the angle of our throw, the weight of the dice, its possible imperfections and so on, and if it was possible to take all of this into account we would most likely be able to determine the number. But it is too complicated so we are happy enough with the predictions we can make thanks to probability theory.
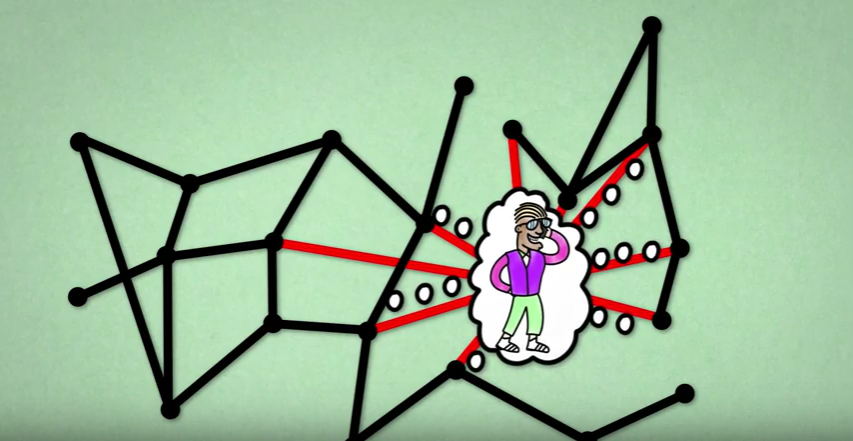
Now, this was just a dice throw, imagine all the complexity hiding behind the infection process. The first layer is the complexity of human contact. Meeting an infected person can be a complete coincidence: a simple decision of staying at work for 15 minutes longer to talk to a colleague might result in taking a different bus and lead you to a ride with an infected person, even though usually your schedules don’t intersect. The second layer is disease transmission: it is not certain if an infected individual will pass the virus on to the healthy one, even if they do meet. Whether it will happen or not depends on multiple factors that are difficult to measure, such as the amount of virus units the infected person carries. The third layer is the fact that we would need to be able to measure such peculiarities not just for two people, but to keep track of them for the whole population.
This is where probability theory enters into the modelling of epidemics. Thanks to it, we can break down this complexity into numbers, in a similar way as we did in the dice throw experiment. This time instead of observing numbers on a dice and the frequency with which each of them is rolled, we look at how many healthy people are infected by each sick person and then summarise how often it happens for an ill individual to infect a certain number of healthy individuals. Mathematically speaking, such a set of all possible outcomes with assigned likelihoods is called a probability distribution. If we know the underlying probability distribution of some phenomena, probability theory gives us tools and laws that allow us to predict its short-time and long-time behavior. Thus, to be able to say something about the time evolution of an epidemic, we first need a good guess for the probability distribution of virus transmission in the population.
And this is where the problems start.
The methodology developed for tackling epidemics comes in large parts from models created some time ago and these models mostly assumed a quite regular pattern of the virus transmission. To give an example of what kind of problems we can run into because of this, I’ll start with an infamous . You are probably familiar with , ‘the basic reproduction number’ – a statistic that epidemiologists use to denote the average number of new infections directly caused by one sick person. Since the pandemic of COVID-19 started, has appeared in all mass media and has been mentioned by numerous politicians. The reason for this sudden growth in popularity is the common belief that this one number has the power to indicate the direction of the ongoing pandemic: namely, that it can tell us whether the pandemic is growing in strength or not.
Unfortunately, it turns out that in the battle with SARS-COV-2 and the previously detected coronaviruses, alone might be very misleading. The reason for this is the fact that in the case of these diseases, the vast majority of infected individuals are not supposed to pass the infection to anyone! And, on the contrary, there are a few people who will infect thousands, giving rise to a so-called superspreading event. Even though such events are rare, they are very dangerous as they can quickly restart an already dying epidemic. Surprising as it may seem, it is a known fact that for coronaviruses the average number of secondary cases follows the 80-20 rule: 20% of current infections are responsible for 80% of future infections. Some research shows that transmission of the COVID-19 virus, in particular, is even more skewed than that, with the actual proportion being as biased as 90-10. In scientific terms, we say that the probability distribution of SARS-COV-2 transmissions is highly overdispersed. If that is indeed the case, it does not come as a surprise that the average does not detect the whole dynamic. So, this whole time we have been looking at a parameter that actually does not deliver a lot of information about the virus causing the COVID-19 pandemic!
Of course, this approach has already received some criticism. Many scientists decided to pair up with the number - a parameter responsible for taking into account the variety in the distribution of infection transmission. Parameter was even advertised by some as the key to overcoming the COVID pandemic but there is not so much reason behind it either. The idea to complement with a parameter capable of measuring overdispersion is definitely good. However, parameter k is actually not a general statistic. It is a feature of a specific and very regular probability distribution that is suitable to describe phenomena with much smaller diversity, such as a dice throw. Hence, it makes sense to use parameter for diseases whose transmission patterns are regular but, as you already know, the transmission pattern of SARS-COVID-2 isn’t.
You might now be asking yourself why we kept referring to old methodology if a lot of evidence on its inadequacy has been provided. Unfortunately, updating the models is not so easy and definitely not quick. It requires a lot of careful re-evaluation, re-calculation and sometimes even designing new mathematical tools. This is why, when faced with the necessity of making quick decisions, the existing mechanism was simply the best point of reference.
It should also be mentioned that the highly overdispersed probability distributions (officially called the heavy-tailed distributions) that are currently the best probabilistic approximation of COVID’s behaviour come with many difficulties. First of all, they are relatively new to probability theory. Even though they were defined quite some time ago, they only started gaining popularity in the 90s, a while after R_0 and the most popular epidemiological models had been introduced. As a result, if they were to be taken into account in epidemiology, new models need to be designed. As you can imagine, the procedure to certify the usage of a model which is later on used to make policies that affect the entire world population has to take some time. Moreover, due to their highly overdispersed nature, heavy-tailed distributions are just not easy to handle mathematically and a lot of research still needs to be done if we want to invent successful tools to deal with them.
However, the price at stake is high so the difficulty and the novelty of the heavy tails shouldn’t be taken as an excuse by the scientists, but rather as an encouragement. Updating models that we use to draw conclusions about coronaviruses is crucial and broader collaborations are essential to give us a chance to fight the future pandemics faster. Even if tricky, heavy-tailed distributions can be incorporated into the decision process. The best example of it is the world of finance, which has been paying attention to them ever since Mandelbrot (1963) showed in the example of cotton prices that rare events (here meaning big and sudden jumps in the price of cotton) are bound to happen much more often than it had been expected before. Since this observation significantly influenced future market predictions, heavy-tails became quite popular in financial and economic sciences. Now it’s time for the world of epidemiology to follow this example.
One of the main building blocks of modern AI-tools are artificial neural networks, abstract models inspired by the structure and functions of biological neural networks which enable machines to "learn". In this article, I will discuss some thoughts on this topic.
If, after reading the title, your immediate response is to shout "1/6-th", then you have correctly answered the question. Well done! However, in this article we will focus on the meaning of this question. What exactly is this "chance" of which you've just exclaimed it equals 1/6-th?
During our teenage years, everything changes. It’s no surprise that our brain does too. But how do we make sense of this transformation? Is there a way to quantify it? Networks might just be the answer.
 . You are probably familiar with
  - a parameter responsible for taking into account the variety in the distribution of infection transmission. Parameter