The tale of the mathematical fairies that move bikes around when no one is watching.
If you have recently been in a big city, you might have noticed the large number of share bikes on the road. On an average day in London, around thirty five thousand trips are made with share bikes. Given that this mode of transportation is healthy, flexible, reliable, cheap and environmentally friendly, such large numbers should not come as a surprise.
In case you never used a share bike yourself, you might fear that it relies on the coincidence of an available share bike close by. If you think however that, from a random point in a city, the nearest bus stop is closer then the nearest share bike, you’re often wrong! Any regular share bike user will gladly tell you about the convenience of available bikes around practically every corner of the city.
How is it possible that bikes are so perfectly spread out that they are available from almost anywhere? Who are these bike fairies that distribute them evenly across the city? Continue reading if you like to find out who they are and what type of mathematics is involved.
Bike sharing viewed as a network
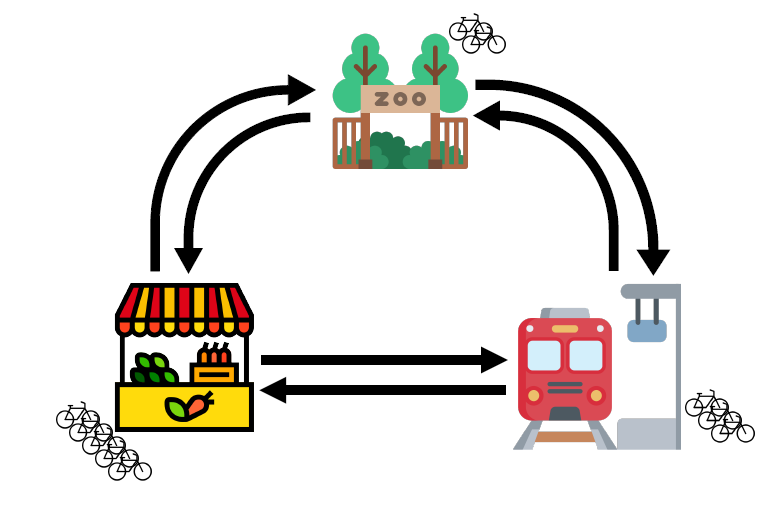
To highlight the first fairy, let us take a small fictional example bike sharing service called ShareNet, which has a total of ten bikes and three pick-up/drop-off locations (from now on abbreviated to just “locations”): the train station, the market and the zoo. In this example the current spread can be described by the number of bikes at each of the three locations, denoted by (train station), (market) and (zoo). Since ShareNet has ten bikes in total, it is always true that .
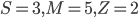
Figure 1: A possible spread of the ten ShareNet bikes across three locations. In this case S = 3, M = 5 and Z = 2.
We are interested in a mathematical formula describing how likely it is to find the bikes spread over the locations in any possible combination (for example the combination in Figure 1). Such a formula is called the steady-state distribution. The best way to understand the steady-state distribution is to zoom in on a single location, say the train station. This location is assigned a value , which can be interpreted as the proportion of time when there is at least one bike there.
The value of is based on two quantities:
the average number of minutes between two consecutive bike pick-ups at the train station, and
the probability that a bike picked up from any other location will be dropped off at the train station.
The larger these numbers, the larger the value of (and similarly, the smaller these numbers, the smaller the value of ).
The steady-state distribution
The steady-state distribution, which displays the likelihood (or probability) of any possible bike spread, is given by
where is a constant that ensures the sum of the probabilities equals 1. In other words, the probability that at any given time, there are bikes at the train station, at the market, and at the zoo, is computed by performing a multiplication in which each factor corresponds to one location.
The fact that each location has its own factor in the formula ( for the train station, for the market and for the zoo), suggests that the number of bikes at any location is independent of all the other locations. Only the constraint that (the sum of the number of bikes at all locations equals the total number of bikes) creates dependence between the number of bikes at different locations.
According to the steady-state distribution, the likely spread of the bikes is determined by the values of and ; in other words, by how often users cycle from a certain origin to a certain destination. So the fairy that makes up these values is the composition of every share bike trip ever taken. Every share bike user may therefore consider themselves a small part of a fairy.
Restoring the balance
For most bike share services however, the steady-state distribution alone does not guarantee a balanced spread. The reason for this is that certain locations are more often the destination than the origin of a bike ride.
For instance, many people may take a share bike to the market, but with their bags full of the goods they bought, they may prefer to take the bus to go back. Over time this causes accumulation of bikes at the market, which is therefore called a bottleneck location. This excess of bikes inevitably causes shortages at other locations, forcing you to walk longer to the nearest bike.
This is where the second fairy, the bike share company, comes in. To keep their users happy, companies try to avoid shortages at all costs. They influence the movements of their bikes around the city to keep the spread as balanced as possible. For example, ShareNet may transport a few bikes from the market to a different location. With just 10 bikes this is not a problem for ShareNet, but many real companies are dealing with hundreds of locations and thousands of bikes!
Different strategies are employed in practice to avoid excess and shortages. Some companies choose for an extra fee for dropping off at a different location (OV-fiets in the Netherlands). Others offer rewards for users that take specific routes that restore balance (Capital bikeshare). A third option is simply not to allow drop-offs at locations that already have many bikes (Donkey bikes).
Mathematical complications
A second problem for large bike share companies comes when the constant in the steady-state distribution has to be determined. Recall that this constant, which is called the normalization constant, ensures that the sum of the probabilities equals 1. The expression for involves a summation over all possible ways that the bikes can be distributed over the locations. For ShareNet this gives 220 terms (which is certainly doable for a computer), but already for a company with ten locations and a hundred bikes, the number of terms to sum up equals over 42 trillion!
Normalization constants actually appear very often in applications of probability theory. Combined with its difficulty to evaluate, much scientific effort has been made just finding ways to slightly simplify its computation.
Without going too deep in the mathematics, let us look at some intuition on what can still be calculated from the steady-state distribution without knowledge of the normalization constant. Remember that the number of available bikes at any location is only dependent on the number of available bikes at another location through the fact that the total number of bikes is fixed.
For locations that make on average a little contribution to this total (that is, locations with few bikes on average) this means that the number of available bikes there is roughly independent of the other locations. Taking the zoo as an example, this would mean that
greatly simplifying the analysis. (For the probabilists: in this case is geometrically distributed and .)
So, two fairies are constantly affecting the spread of the bikes across the city. On one hand, all share bike users combined form a large network which is described by the steady-state distribution. Bike share companies, on the other hand, try to understand the mathematical behavior of the network, and make various adjustments for optimal balance. As a result, it is likely that the walk to your nearest share bike is quicker than the time it took to read this article.
Rafael Prieto-Curiel is a mathematician and a faculty member at the Complexity Science Hub in Vienna, Austria. His research focuses on crime, mobility, migration and urban dynamics. We interviewed Rafael to learn about his story.
If, after reading the title, your immediate response is to shout "1/6-th", then you have correctly answered the question. Well done! However, in this article we will focus on the meaning of this question. What exactly is this "chance" of which you've just exclaimed it equals 1/6-th?
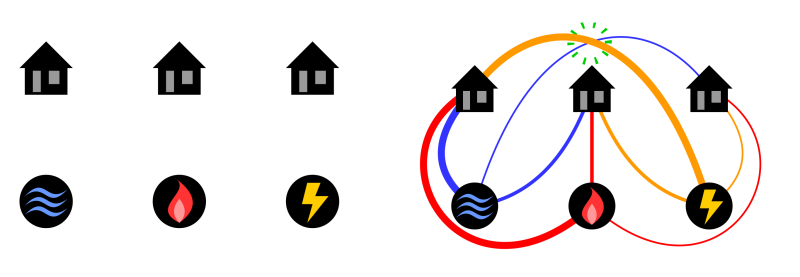
In this article Maya continues her journey from Rotterdam to Brussels. She starts thinking about a puzzle from her childhood, the three utilities problem. At the end of the jouney she has reached a very important theorem from graph theory!
During our teenage years, everything changes. It’s no surprise that our brain does too. But how do we make sense of this transformation? Is there a way to quantify it? Networks might just be the answer.
 (train station),
  (market) and
  (zoo). Since ShareNet has ten bikes in total, it is always true that
 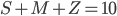 .
.
 combination in Figure 1). Such a formula is called the steady-state distribution. The best way to understand the steady-state distribution is to zoom in on a single location, say the train station. This location is assigned a value
  , which can be interpreted as the proportion of time when there is at least one bike there.
 is a constant that ensures the sum of the probabilities equals 1. In other words, the probability that at any given time, there are
  bikes at the train station,
  at the market, and
  at the zoo, is computed by performing a multiplication in which each factor corresponds to one location.
 for the train station,
  for the market and
  for the zoo), suggests that the number of bikes at any location is independent of all the other locations. Only the constraint that
  and
and  ; in other words, by how often users cycle from a certain origin to a certain destination. So the fairy that makes up these values is the composition of every share bike trip ever taken. Every share bike user may therefore consider themselves a small part of a fairy.
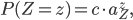
 .)
.)