How taking random decisions can help you win the elections.
Once, when I was a high school student, a professor told me that one of the most fascinating aspects of science is that it usually helps you to connect things that you would never think to have connections. From a historical point of view, such connections were often related to mysticism or madness: not so many years ago you would have been accused to be an alchemist if you were claiming that the Moon has something to do with tides, not to mention what would have happened if you were admitting that our species descended from monkeys.
In this article, dear reader, I am going to show you in which way the development of your opinion during the last political issue, the spread of a virus among your acquaintances during the current pandemic, and the alignment of some particles lying inside the device from which you are reading this article are extremely comparable phenomena.
Pretend for a few minutes to identify yourself as Donald Trump, D. from now on. You would probably be obsessed with how to win back the voters you had a few years ago and, in doing so, you may ask yourself how the opinion of an average voter evolves as time goes by, starting from today up to the next election day. Here we can already point out a crucial aspect of D.’s dilemma: he does not care about the background of their voters – what work they do, social class, interests, etc... –, instead he focuses on their average social behaviors.
If D. were a Networks-scientist, he would know that in his draft there is important information that is missing: how the opinions change over time! Since otherwise he would be assuming that, as time goes by, none of the voters change their opinion, and this is not accurate enough even for our raging orange friend. If you think of yourself when you are about to vote how do you form an opinion on who to vote for? You read, you go to discussions, you follow the news, you discuss with your friends, family, and colleagues, and in the end, you take a decision. If all your friends, for example, are very enthusiastic about a candidate you may decide to vote for them. How can we understand how this very complex process of opinion formation works? In modern mathematics and physics, we often think of it as a rather random process, since there are many parameters affecting your decision.
Suppose now that in D.’s model each voter can have at each time step, say each day, one of two possible opinions: 0 or 1, red or blue, Republicans or Democrats, Fox News or CNN–choose the couple that tickles your imagination the most. Given the opinions of all the voters today, you would like to know their opinions on the day of the elections. In other words, given the initial distribution of the opinions, you would like to know the value of all the opinions on the day of the elections. For this purpose, you need to specify how the opinions change (randomly) in time in your model, more precisely you need to write down the “rates”, i.e. the speeds, at which each person can change their opinion at each time step. All the magic, Mr. Trump, is here: the way you tune your rates, making them less or more detailed, together with the opinion dynamics defines the model completely. The next example, which we will consider to be our reference model from now on, will provide a clear image of what I mean by the previous sentence.
Let us consider now the following updating rule, describing the rates, that gives rise to a well-studied probabilistic model called the “Voter Model”. The interpretation of the updating rule is the following: suppose that tonight you are hanging out with a group of friends and, after drinking something, the debate focuses on the coming political issue, if you have a certain idea about who to vote and most of your friends have the opposite opinion then there is a chance that you may change your mind about it.
Let us translate the latter heuristic in terms of our model. On each day (time step) pick randomly a person (colored dot) and select, again randomly, one of their neighbors/acquaintances (trough the lines). If the opinions of the two acquaintances at that moment are equal then nothing happens, instead, if they are different, then the first-chosen person changes their mind and adopts the opinion of the randomly selected friend. In our picture with dots and lines this corresponds to changing a red dot into a blue one and vice versa.
Animation of this updating rule
In the animation below you can experiment yourself with this updating rule. By clicking on "Initialize weights" some points will be colored green. How many points will be colored green can be chosen by the user, then this amount of points will be choses at random out of the five points and will be colored green. By clicking on "Next Step" you can see how the updating rule works. If you slide the cursor "Timestep" to the left you will see the steps in an animation.
Agreed, but there are still several open questions. Is D. going to win the elections with this model? Or better, is such a model somehow related to the opinion dynamics in the real world or we are just having fun with a useless toy? If not, is it possible to improve it? How? I promise you will find all the answers to these questions by the end of this article, but before that let me justify the catchy title at the top of this page. In particular, I want to convince you that it is possible to describe completely different phenomena with almost the same model that we have just built.
At this moment I encourage you to look back to the fascinating story of our American president and his model construction procedure. Consider again the dots mentioned before. We called them voters, but actually, the only quality that gives them this title is the understanding of what we called “opinion”. Take now the same picture, colored dots with lines, but this time in place of opinions we attribute to the nodes one of two possible states: healthy or infected. We are only left to introduce two speeds, concerning the rate at which a person (dot) can pass from being infected to healthy and vice versa. We have successfully built an epidemic model. One last step. Did we really use in our construction that the dots have limbs, can breathe, or can type on a laptop?
Not really. Indeed, no one prevents us from interpreting those dots as particles lying on some types of rocks -most of them used to build internal components of electronic devices- defining their magnetic dipole moments, or spin. Not familiar with that? No worries, the only relevant fact for us is that these particles appear with a feature that we can simplify by denoting it as orientation (spin). These spins can only be assigned two values: +1 for 'spin up', and -1 for 'spin down'. It is well-known that these particles have the tendency to interact with their neighbors. Or, in technical terms, they tend to polarize. This means that they flip the direction of their spin – from up to down, +1 or -1, or vice versa – at a certain speed. This speed depends on the number of atoms around them that have a different spin than themselves. Sounds familiar, right?
As you have noticed, I was able to describe completely different natural phenomena with almost the same model: with such a lens the diffusion of an infection in a group of people, the polarization of a piece of metal, and the spread of the consensus for a political party before the elections are not so far apart. Just like a good book, this model can give us different interpretations depending on the question we ask. This collection of models falls under the umbrella of a family of probabilistic models called Interacting Particle Systems (IPSs). Here, the term “particle” can be interpreted as a real physical particle but it can also refer to voters and viruses. One of the most fascinating aspects of them is their impressive ductility and, besides their simplicity, they show extremely non-trivial behaviors.
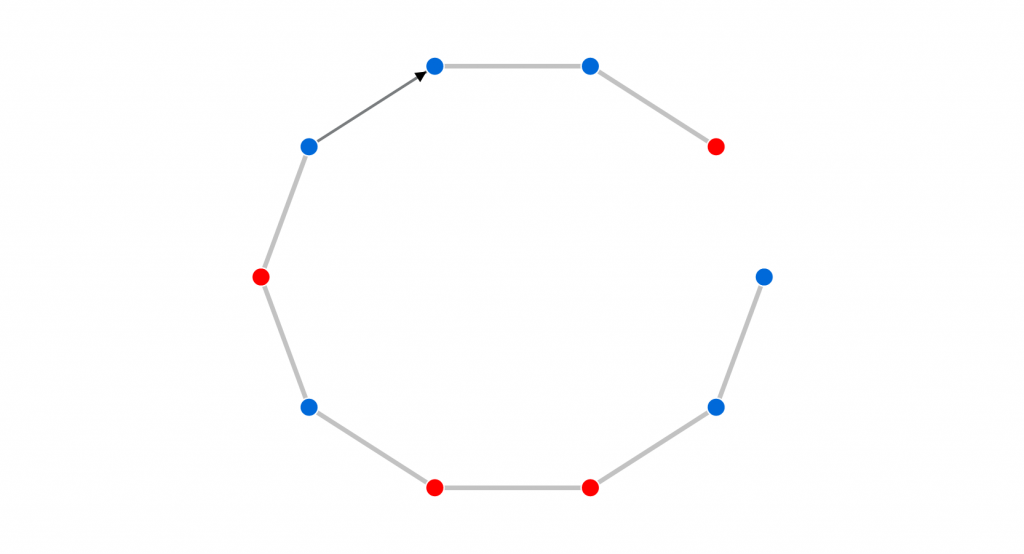
I am really proud of you dear reader, if you reached this point it means that you are genuinely interested in the questions posed a few lines ago about the fate of D.’s strategy: is his construction useful? If not, can it be improved? Does it relate to an election dynamic? To answer them, let me briefly introduce you to some fancy concepts: remember the dots (voters, particles, infected people) mentioned before? Call them vertices; the lines (acquaintances, particle interactions) connecting the nodes: edges; while D.’s picture of dots and lines, is a graph. Now you can tell your friends that you know what an IPS evolving on a graph is. Let us focus on the Voter Model on graphs, using the same updating rule explained before. First, we can notice that, since the graph is finite, surely sooner or later all the vertices will share the same opinion, the consensus state. Thus, it should not be surprising that the main object of study is the so-called consensus time, that is the expected time (in terms of the number of time steps in which we update the vertices' opinion) needed to reach the consensus state. This value mainly depends on the size of the network , i.e., the number of voters. A small step back: clearly at this point, you may wonder why should we take care of the case in which all the citizens are voting for Trump. This is a good point, whereas such a connection is much more direct in the infection and polarization cases, in the Voter Model this is less evident and must be taken as an approximation of the real-world event that corresponds to “winning the elections”.
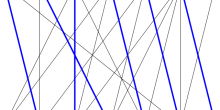
It turns out that the consensus time is rather difficult to study in full generality since, as it is quite intuitive from our perspective, it strongly depends on the shape of the graph: a social network formed by a horizontal line - each voter has only two friends/acquaintances/neighbors - is significantly different to the complete graph, in which each voter is connected with all the other possible voters in the network. In fact, in the line graph, the number of updates of the opinions necessary to reach the consensus time is roughly , where is the number of vertices – voters – of our graph, while in the complete graph the consensus time reduces drastically to roughly . Hence a consesus is reached much faster when everyone can communicate with each other, than when playing chinese whispers.
Figure: A consesus is reached much faster when everyone can communicate with each other, than when playing chinese whispers.
There are also some kinds of heterogeneous networks, i.e. more similar to the real-life ones, that have a consensus time of the order of . What does this mean? Well, in his model, our friend D. has to do with an million magnitude of eligible voters in the US. Therefore, making a mistake in the model assuming a network structure that is too different from the real one would potentially cost D. an error in the computation of the consensus time!
At this moment it is wise to take a step back and visualize D.’s dilemma from a different perspective. Is it just a toy model to have fun with? Or does it really have some connection with how opinions are formed? Unfortunately, the right answer is the less enthusiastic one: reality is much more complex than this. But how far are we from the right amount of complexity? Not so much, we only need to give D. the right hint. It will turn out to be: “Add more randomness”. How? Do you remember the lines in D.’s paper connecting the voters, the edges? Make them random. For every couple of nodes flip a coin, if the result is head then D. should draw an edge, and leave it blank otherwise. On the resulting realization of such a random graph run the Voter Model that we were playing with, that is implement all the opinion dynamics rules that we discussed before. The surprising result is that what comes out is much more related to a real-life election than the previous model!
Animation of the Voter Model
This animation starts with generating the graph according to the following procedure: we prescribe for each vertex the number of edges it should have, draw the corresponding 'stubs' and then randomly connect these stubs, which might lead to some self-loops and double edges. This is called the configuration model. Afterwards, the vertices are colored at random either blue or red, and then you can run the Voter Model. By clicking on "Next Step" you can see how the graph is generated. If you slide the cursor "Timestep" to the left you will see the steps in an animation. By clicking on "Initialize Weights" and "Next Step" you can run the Voter Model and decide yourself how many vertices will be green.
Why? The intuition comes from the fact that in this way, by adding randomness, D. can catch part of the unpredictable behaviors regarding how groups of people change opinions on a given issue. A key idea here comes from the fact that one does not need to know all the details of the dynamics we are interested in (voting/infection/magnetization), but it may be sufficient to know that in a social network there are some structural properties, as communities or people with a lot of influence, which have a strong impact on these dynamics.
Using a similar argument, we could do a step further having in mind the following idea: most people, on average, may change their friends as time goes by, so why don’t we try to model this behavior? The answer is that it is quite hard, but not impossible. This technique is called “rewiring” and there is still a lot that we need to understand about it, indeed it is an extremely interesting research topic.
In conclusion, the adventure of our favorite president has a dignified ending. He only needs to arrange his dots-and-lines draft on a sheet of paper in such a way that his model is not too simple, and he could get accurate estimates of the time necessary to achieve the consensus time. Moreover, as we noticed at the beginning of the article, it should not be surprising that all the statements claimed in the last few paragraphs hold, with the right interpretation and small corrections, for the spread of a virus in a large population and the magnetization phenomena in ferromagnetic materials. It is worth remembering once again that we are still talking about models, an extreme simplification of reality that aims to give us some useful glimpse of its behavior.
Going back to D.’s story, if he had an accurate model in his hands, he would probably be able to get some insights into how long it would take to win back the consensus and, perhaps, wait until then before running the next elections or even focus his election campaign on areas where it may be easier to spread his consensus. Rephrasing a famous quote: All models are wrong, but some of them could help you win the elections”.
This line of research in NETWORKS is funded by the European Union’s Horizon 2020 research and innovation programme under the Marie Skłodowska-Curie grant no. 945045. The featured image was made by Web Vectors by Vecteezy.
If, after reading the title, your immediate response is to shout "1/6-th", then you have correctly answered the question. Well done! However, in this article we will focus on the meaning of this question. What exactly is this "chance" of which you've just exclaimed it equals 1/6-th?
The probabilistic method was pioneered by the Hungarian mathematician Paul Erdős, famous for his many contributions to combinatorics and graph theory, and it has since become an important tool in these areas of mathematics. Is this article you will learn how it works!
In Part 1 Jackie explained to her fried Sam how the problem of picking a card from each of the 13 piles so that there is exactly one card with each rank translates to a problem on bipartite graphs. The mathematical problem asks you to find a perfect matching in a regular bipartite graph.
 , i.e., the number of voters. A small step back: clearly at this point, you may wonder why should we take care of the case in which all the citizens are voting for Trump. This is a good point, whereas such a connection is much more direct in the infection and polarization cases, in the Voter Model this is less evident and must be taken as an approximation of the real-world event that corresponds to “winning the elections”.
 , where
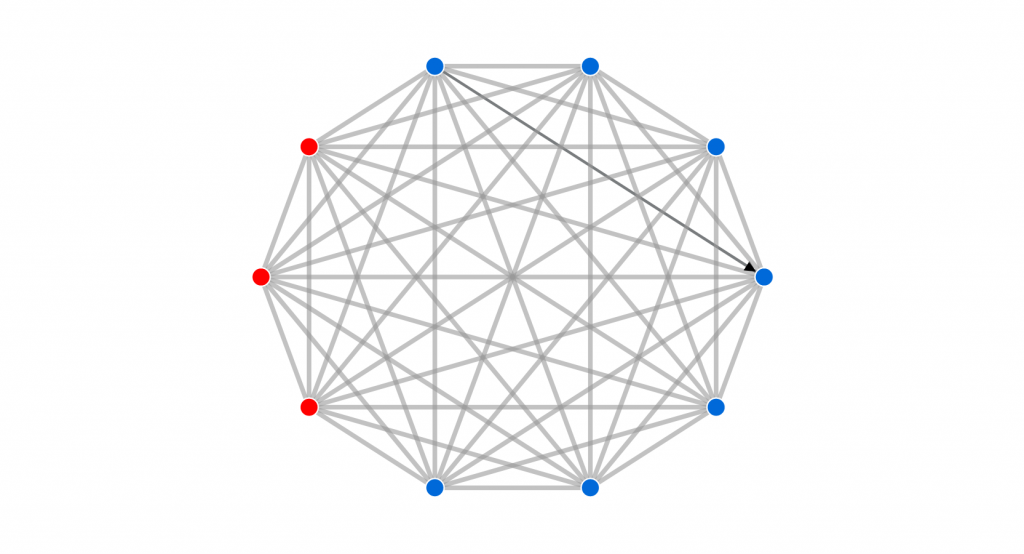
 . What does this mean? Well, in his model, our friend D. has to do with an
  million magnitude of eligible voters in the US. Therefore, making a mistake in the model assuming a network structure that is too different from the real one would potentially cost D. an
 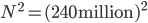 error in the computation of the consensus time!
  All models are wrong, but some of them could help you win the elections”.