Making decisions that affect traffic can have an enormous impact on our daily lives, the environment and our economy. We should therefore do our best to ensure that traffic runs as smoothly as possible.
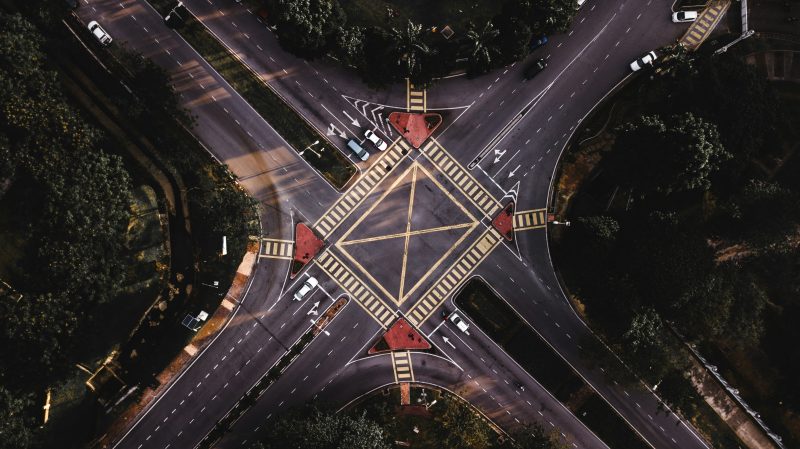
Imagine that you are working at the government department that manages the infrastructure, and you are sitting in your office. It is morning rush hour and many vehicles occupy the main highway leading to the capital city, when all of the sudden there is an accident! When you look on the camera images of the road, you see that a large truck and its trailer are tilted in the right lane! As a consequence, there is a huge traffic jam!
It is your job to turn on the matrix boards above the highway, but what maximum speed should you put there to ensure that oncoming vehicles do not crash into the tail of the jam? Should you close off a road, and what impact will this have on the delay that drivers will experience? How long will the traffic jam last, and when road users start taking detours, how will this affect the busyness of other roads? In addition, there are other, larger issues that you have to consider.
Your decision might have economic impact, since there will be delivery trucks in the jam that are going to be delayed. There is also the effect on the environment, due to all the extra emissions, caused by the accelerating and braking in the traffic jam. Perhaps most importantly, could these consequences have been prevented (to a certain degree) by effective design of the road network?
In 2014, in the Netherlands, Belgium and Germany, the average person spend approximately 40 hours in a traffic jam - that is 5 work days!
In this article, I will explain how mathematical models with uncertainty help traffic engineers to make decisions that improve traffic.
Mathematical (traffic) models
First, let's see what mathematical models are, and how they are helpful. In general, it is very difficult for traffic engineers to make `the right decisions' concerning traffic situations, like in the case of the traffic jam. Would you be able to answer the questions asked in the introduction? To help them in making these decisions, mathematical traffic models have been developed.
To illustrate what a mathematical model is, you can think of a toy car of a Ferrari (which is also called a model car). Such a toy car is not precisely like the Ferrari, since it does not contain a working engine, is made of different material, is much smaller, and so on. However, it does give you a good idea of the shape, how it looks when it is driving, and how it compares to other toy cars. As another example, architects make models of their buildings on a small scale (also called a scale model) to study how they would look, how much light will enter the building, how much material is needed, and so on.
In a similar way, mathematical models describe a real-life phenomenon, using mathematical concepts and language. The model will not exactly be like the reality, but can be used to learn from. The idea of a traffic model is to replicate the dynamics of traffic as accurately as possible, so that the model can be used to make predictions on how traffic will behave under certain decisions. These predictions can be, for instance,
example 1: given that there is a traffic jam at this moment, at which time t > 0 will the traffic jam be dissolved?
Or, when evaluating the impact of decisions:
example 2: if the maximum velocity is temporarily changed on a road segment, by how much will this increase the time that it takes vehicles to traverse the segment?
An example of a traffic flow model is the cellular transmission model (CTM), given by Daganzo (1995) which shall be considered on a high level.
Consider a road, that is divided in segments, each of equal length . On every segment , there will be a number of vehicles , which is a integer number between and ; the maximum number of vehicles that fit in a cell.
Through time, each vehicle will drive with a certain speed, passing from one segment to another. This speed will be dependent on how busy it is in the vicinity of a vehicle; if it is quiet on the road, a vehicle will drive with its maximum velocity, but if the road becomes congested, the speed will decrease.
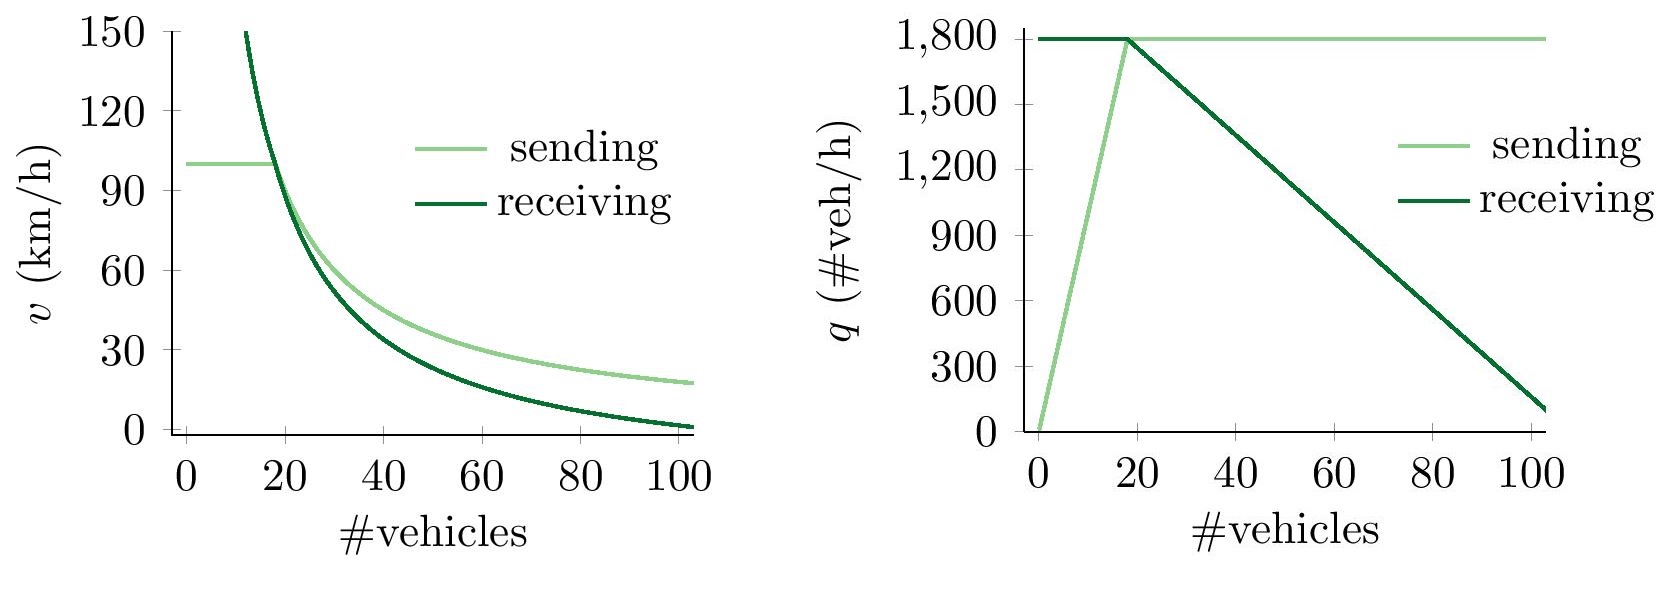
This is illustrated in Figure 1, in the left figure, which shows two curves that correspond to two neighboring segments. The `sending' curve shows the speed that a vehicle can maximally drive due to the busyness around it, i.e., due to the number of vehicles that are in the same segment. The `receiving' curve shows the speed that a vehicle can maximally drive due to vehicles being in front of it, i.e., due to vehicles that are in the next segment. The actual speed that a vehicle will drive will then be the minimum of the two.
If you know how fast a vehicle is driving, then you also know how long it will take before it will transverse a segment of length . By assuming that vehicles are equally spaced over a segment, the number of vehicles going from segment to is equal to , which is called the flow (), measured in number of vehicles per unit of time. The flow curves, corresponding to speed curves from before, are given in Figure 1, on the right.
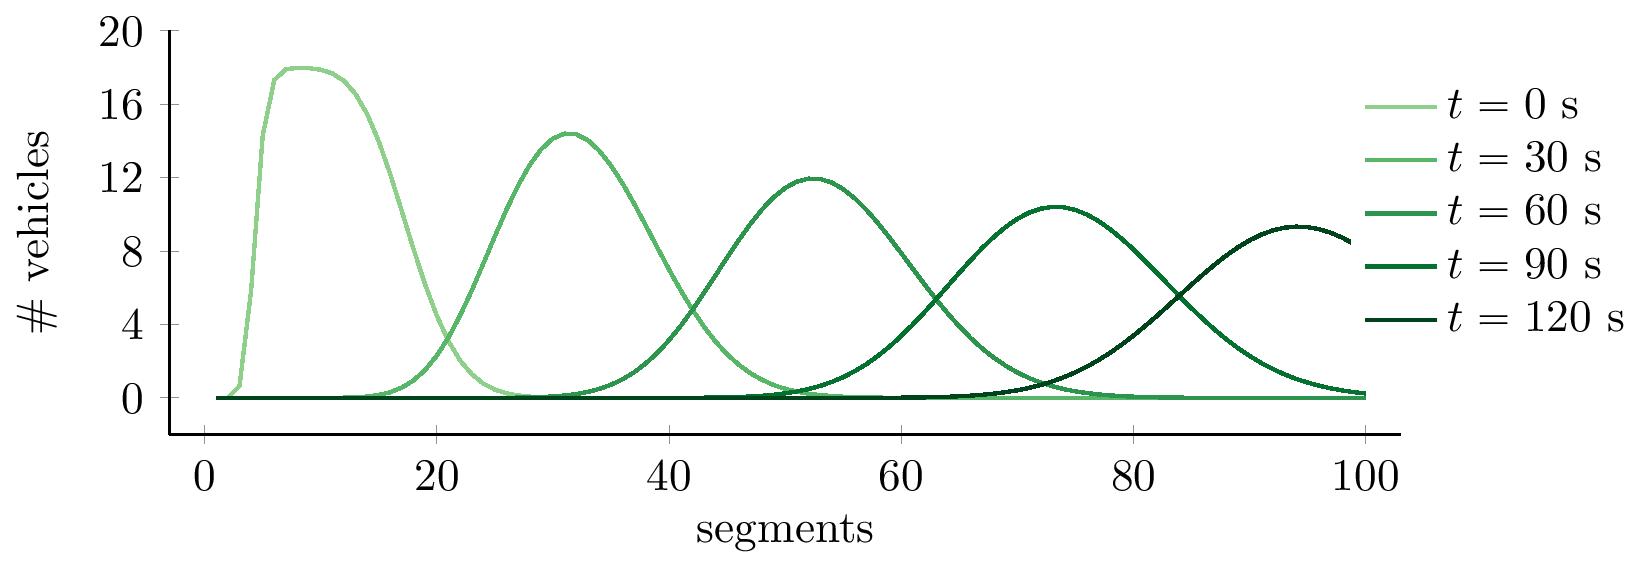
Now, if you want the number of vehicles that passes from one segment to another, over a time of length , all you have to do is to consider the minimum of the flow curves in Figure 1, and multiply it by . Doing this repeatedly, and moving the vehicles over the segment, will let traffic drive of the segments. In Figure 2 you can see snapshots of the state of a road, with 30 second time-intervals. You can see how an initial cluster of vehicles at time , will spread out over time, while driving over the segments. For this figure, a length of 400m for each segment has been taken, and a maximum speed of 100 km/h.
Image by Alexander Grishin from Pixabay.
Unfortunately, it is not that easy to develop a useful traffic model. The reason: too many variables. Consider how many aspects influence traffic: human behavior (personalized driving behavior, moods, responsiveness, perceptions, etc.), the weather, differences in vehicle velocity and size, differences in the size and shape of the road (number of lanes, width of every lane, whether there are turns, degree of sharpness of the bends, etc.), the number of (potential) road users, the degradation state of the road, and so on. Let's call these aspects variables.
A mathematical model that takes all these variables into account would no longer be usable, because it would take too long to calculate answers to questions like examples 1 and 2, or, because of the complexity, it would no longer be able to calculate answers at all.
According to a survey, the average daily American commute totals approximately 35 minutes. That's about 152 hours - or 19 full work days a year - driving to work in their cars.
So, traffic engineers have to deal with many important issues where they need to make decisions that influence traffic behavior, but they are unable to make useful predictions with mathematical models. Without these predictions, they are more likely to make wrong decisions. As a consequence, traffic jams take an unnecessary large amount of time to dissipate, or road networks will be inefficient, making it necessary to construct roads multiple times. This is wasteful and costly. What can they do? Should they choose to leave variables out of the model? This is unwanted, because they would throw away information that is important for the traffic model. Besides, there is a better option.
Photo by Skitterphoto from Pexels.
Traffic models with uncertainty
Mathematicians have a technique for dealing with problems with many variables, namely the use of models with uncertainty. To manage the large number of variables, mathematicians distinguish between variables with a large or with a small influence. For example, in traffic there are important variables that have a great effect on the flow of vehicles. These include: the size and shape of the road, differences between vehicles and the amount of traffic on the road. In contrast, there are less important variables that only have a small effect on traffic, such as the mood of drivers and personal driving behavior.
In such cases, mathematicians often use models that include the important variables explicitly and that include the less important variables as random variables (sometimes called stochastic variables). These are variables of which the value is determined by a random experiment. A classic example is the outcome of a die roll. When rolling a die, you typically do not know the outcome beforehand; only when the die has landed you know the outcome. By the way, such an outcome is called a realization of the die (the random variable).
Some intuition on the idea of random variables: The above statement, that you do not know the outcome of the die beforehand, it not entirely true. If you would know the initial position of the die in your hand, the velocity and angular momentum with which you throw the die, the density of the air in the room that reduces velocity of the die, and so on, then you could use physics to predict the outcome of the die roll. In practice, though, you could not possibly know every variable, and its influence, that determines the outcome of the die roll, and thus the die roll can be treated as random. Every time you throw the die, the outcome is unknown, until it lands on a number.Similarly, if you pick an arbitrary road user from the highway, then you cannot possibly know what his or her driving habits are. As such the variable driving habits, corresponding to a vehicle, is treated as a random variable.
By treating certain variables as random, you end up with a model with uncertainty; a stochastic model. The outcome of a stochastic model for traffic will be, for example, the following: example 3: given that there is a traffic jam at this moment, what is the probability that the traffic jam will be dissolved at time ?
Or to evaluate the impact of decisions: example 4: if the maximum velocity is temporarily changed on a segment, what is the probability that vehicles will have to travel more than an additional 5 minutes because of this?
The big advantage of these models is that you get a model with fewer variables, so traffic engineers can still use it to calculate the answer to these types of questions. The disadvantage is that the answer they get has a margin of error, depending on the degree of uncertainty.
Let's make a small adaptation in our example model, so that it becomes a stochastic model. Remember the flow curves in Figure 1, giving the flow of vehicles passing from one segment to another per unit time. The model is changed as follows: the time that it takes for the next vehicle to go from a segment to the segment that is adjacent, will be a random variable with average outcome . In this way, there will be uncertainty in the time that it takes a vehicle to traverse a segment, but on average it will remain the same as it was.
The interpretation of the uncertainty is that you do not know what microscopic variables determine that vehicles will drive faster and slower. Therefore, the time that it takes vehicles to cross a certain part of the road, which is dependent on these microscopic variables, is modeled as a random variable.
The Central Limit Theorem
Now that you have a model in which you include certain variables as uncertain, the question is: how can you calculate the answers to the above questions? In general, an explicit calculation is not possible, simply because the associated equations are too complex, even though the complexity has been reduced by introducing uncertainty to the model. Fortunately, there is a technique that roughly gives the answers, or in mathematical words: this technique gives an approximation of the probabilities that you would want to calculate.
This technique uses the Central Limit Theorem (CLT). The CLT is perhaps the most important theorem in the mathematical areas of probability and statistics, and says about the following:
Suppose you have a large amount of realizations of some random phenomenon, each of them not influencing the outcome of others. Then the average of all these realizations is approximately a random variable that has a normal distribution.
A normally distributed random variable has values in and its outcomes obey a specific pattern, from which we are able to compute the probabilities. A nice illustration of how to obtain a normal distribution is a Galton board.
The marvelous feature of the CLT is that it does not matter how the random variables themselves are distributed; when they are similar random variables that do not influence each others outcomes (this condition is very important!), then their sum is always normally distributed. This universality makes this mathematical theorem enormously powerful and ensures that you can use it to analyze, for instance, stochastic traffic models.
Remember the questions that were asked in the introduction, about decisions concerning the traffic jam? By using a stochastic traffic model, that accurately reflects reality, a traffic engineer can realize what will happen when, for instance, the maximum speed is lowered on the segments surrounding the traffic jam. Due to the randomness, like in a die roll, there are multiple outcomes, and in order to get a good idea of what will happen under the decision, a large number of realizations have to be considered. The central limit theorem then gives you an average outcome, and an idea of how certain you are about deviations from the average.
It would be too involved to do the calculations here, but let's consider some example numbers. Say that by lowering the maximum speed from 100 km/h to 70 km/h, the probability that people will lose 5 additional minutes will be 50%, but the probability of an accident will decrease from 1% to 0.01%. Would you make this decision, or would you decrease the maximum speed even more?
The nice thing is that you can consider a large number of possible options, before actually making the decision, by simply computing these numbers for a whole set of different choices. Therefore, you can make an informed decision, and save a lot of time, pollution and money. This is why mathematical (traffic) models involving uncertainty are so important.
Our current traffic management systems are designed for human-driven vehicles, which begs the question: can traffic management systems be made more efficient when dealing with autonomous vehicles?
Rafael Prieto-Curiel is a mathematician and a faculty member at the Complexity Science Hub in Vienna, Austria. His research focuses on crime, mobility, migration and urban dynamics. We interviewed Rafael to learn about his story.
During our teenage years, everything changes. It’s no surprise that our brain does too. But how do we make sense of this transformation? Is there a way to quantify it? Networks might just be the answer.
If, after reading the title, your immediate response is to shout "1/6-th", then you have correctly answered the question. Well done! However, in this article we will focus on the meaning of this question. What exactly is this "chance" of which you've just exclaimed it equals 1/6-th?


 ?
?
 and its outcomes obey a specific pattern, from which we are able to compute the probabilities. A nice illustration of how to obtain a normal distribution is a Galton board.