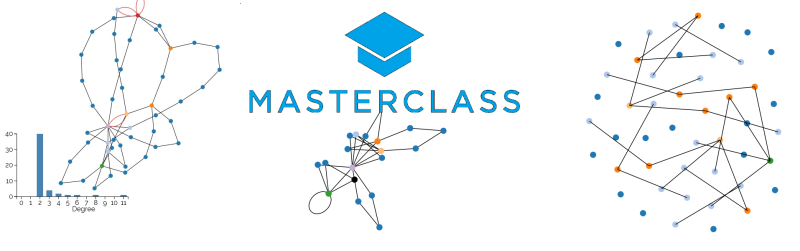
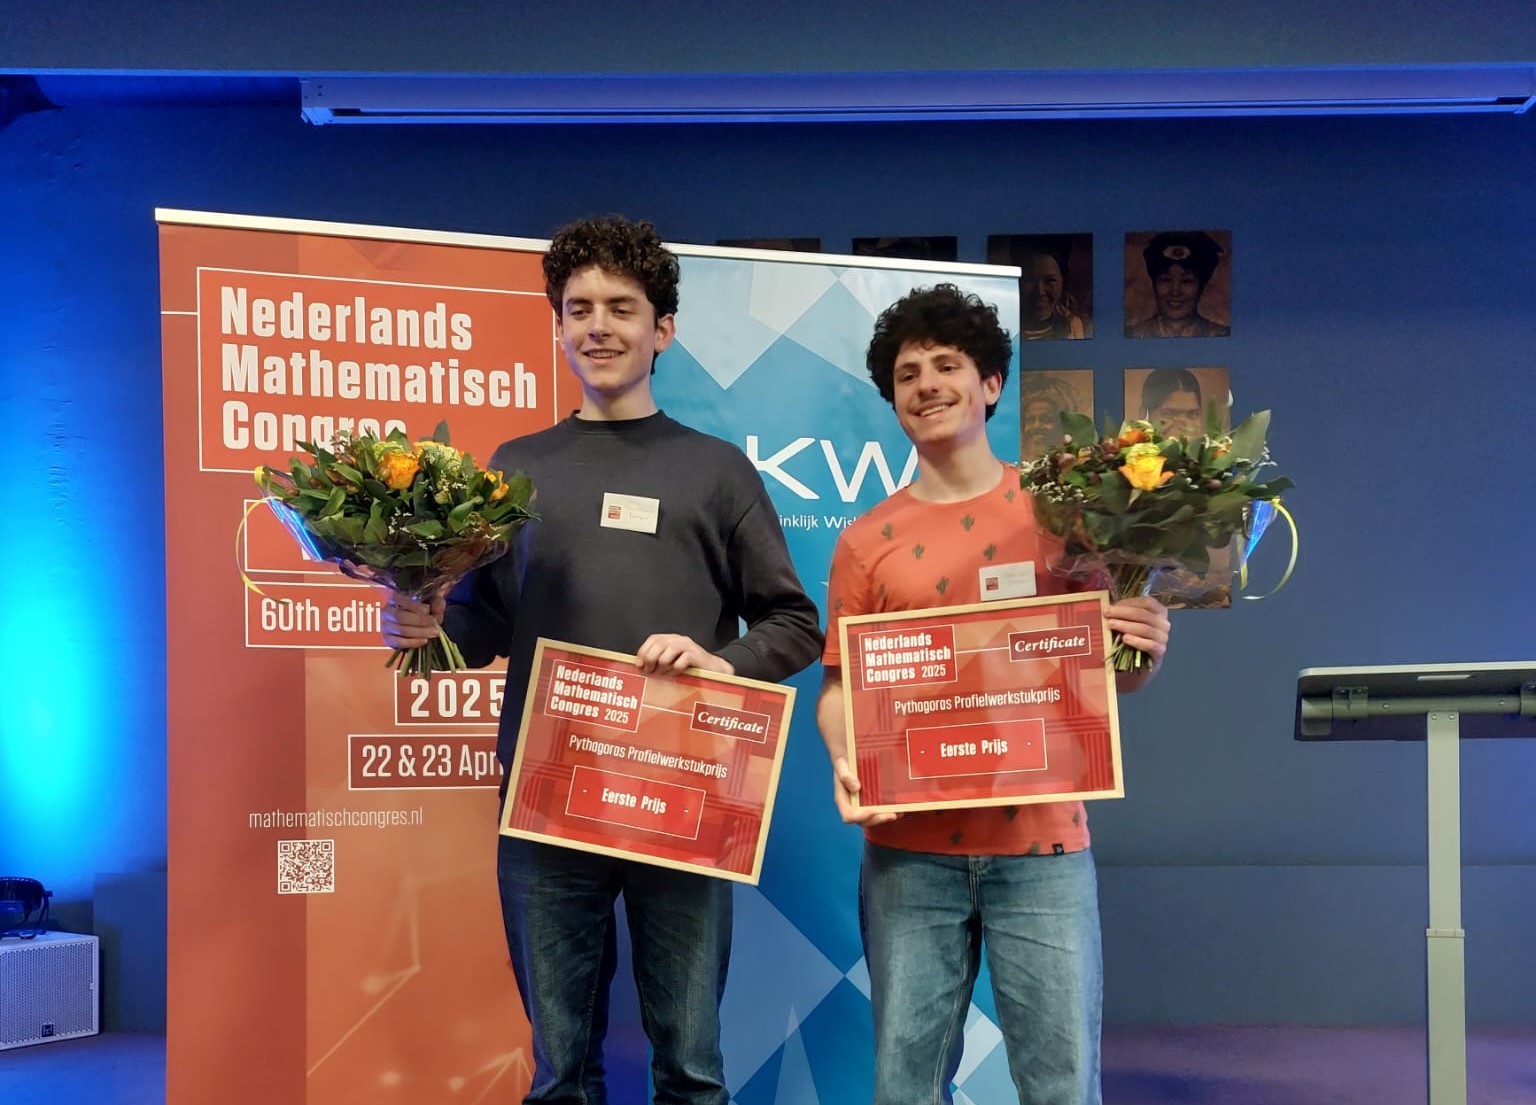
During the Dutch Mathematical Congress 2025, Dylan and Tobias were awarded the Pythagoras Thesis Prize for their excellent high school thesis on graph theory and traffic models. Dylan and Tobias participated in the 2024 Masterclass NETWORKS goes to school, which inspired their work.
“Please get a note…” That’s what the English teacher would always tell us whenever we entered the classroom, even a second after the bell rang. Being late meant reporting to school extra early the next day. And so the day after, we would get on our bike early (we're Dutch students after all!), pedaling through the early morning mist, to get to school by 8:15. Not only was it frustrating for us, but also for the teacher, whose lesson got interrupted. Getting to class on time isn’t difficult, if you leave on time and take the fastest route. But what exactly is the fastest route?
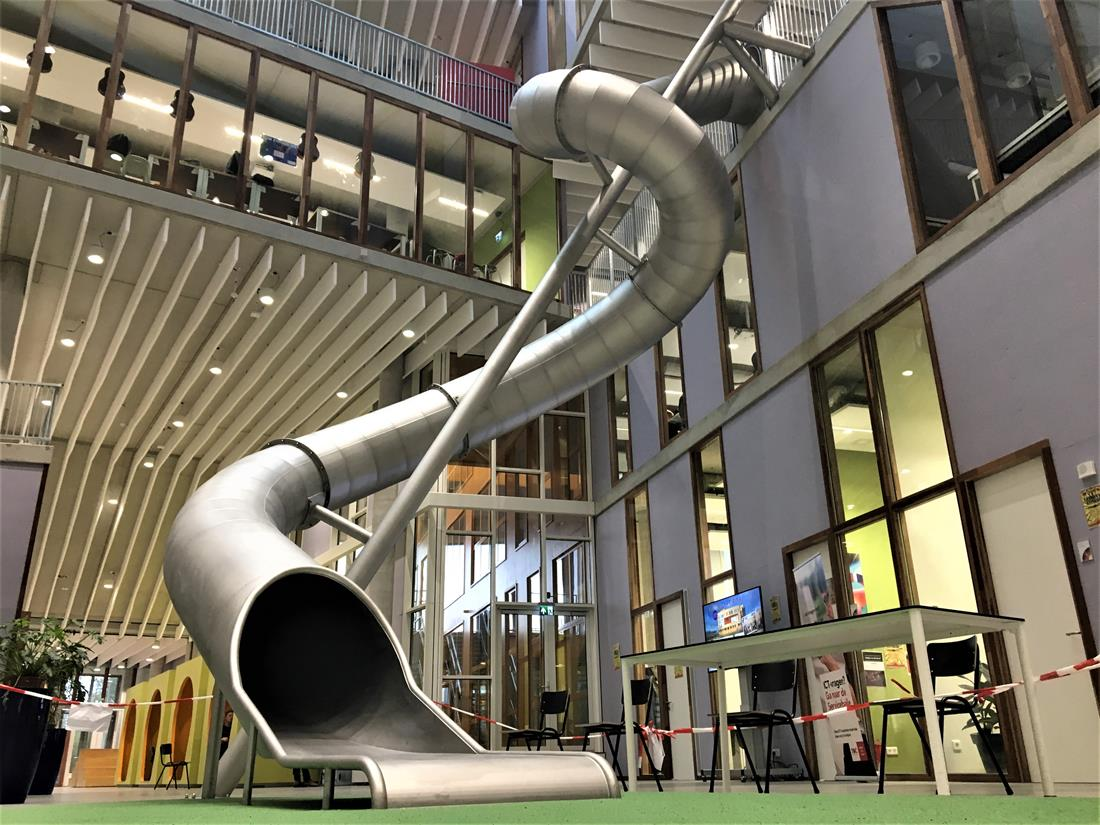
Picture this: the bell rings, and you need to get from the cafeteria to math class. You know the way, though you’ve never actually measured if it’s fastest route. You stuff your lunchbox into your bag and start walking. Before you know it, you’re stuck on the stairs, trapped behind freshmen whose overstuffed backpacks take up way too much space in the hallways. Should you have taken a little detour to dodge the traffic jam? Maybe you should have used the slide instead (yes, our school actually has one!). In this case, the shortest path is not the fastest route! For our high school thesis, we built a website that makes finding the best route around school a whole lot easier. And behind the scenes? It’s all powered by some pretty awesome math!
The slide at the Hyperion Lyceum: to figure out just how fast it was, we went down it no less than eight times!
The shortest path
Let’s start simple. Imagine there are two routes from the cafeteria to the math classroom that seem roughly the same length. Which one is actually the shortest? Sure, we could measure how long each route takes. But doing that for all the thousands of possible paths in a school building would take years. With a bit of math savviness—and a touch of laziness—there’s a much better solution.
Instead of measuring every complete route, we break them down into smaller route segments. This way, we only have to measure the length of a hallway once, and we can apply that measurement to every path that passes through it.
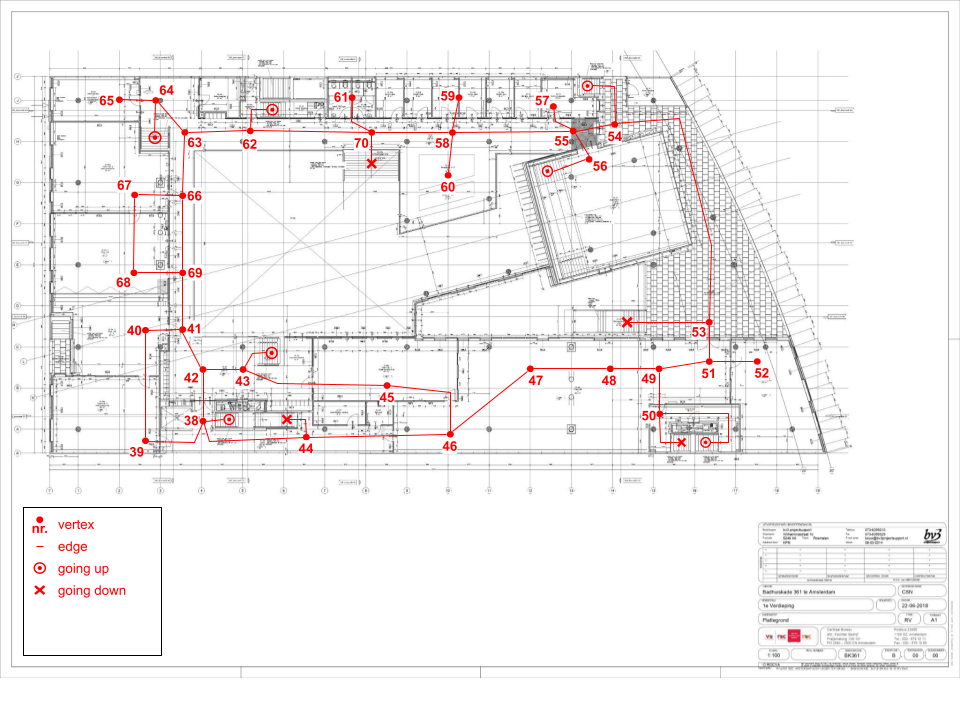
We model the school’s layout as a graph. (You can read more about graph theory in this article) In this graph, all the hallways, staircases, and other possible route segments are represented by lines (called edges). Important locations like classrooms, bathrooms, and intersections of route segments are represented by numbered points (called vertices). Below is the floor plan of the first floor, showing a portion of the graph. The entire graph covers the whole school building—no fewer than six (!) floors.
Floor plan of the first floor. The constructed graph is shown in red.
Now that we’ve broken the building down into a clear network, we can measure each individual edge. You could, of course, walk every segment and time it. Fortunately, we can also simply measure the distance on the floor plan and convert it (using an average walking speed of 1.34 m/s) into a travel time. If needed, we can add time for stairs or doors. By adding these measurements to the edges of the graph, we get a weighted graph.
A weighted graph is a network of vertices (points) and edges (lines), where each edge is assigned a weight. This weight could represent a distance or a time — in our case, it’s time.
This graph forms the foundation for applying Dijkstra’s shortest path algorithm. Dijkstra’s algorithm is like a recipe, a step-by-step method for finding the shortest route between a starting point and a destination in a graph. You can read how it works exactly in this article.
Dodging freshmen
With the approach we’ve developed so far, we can find the shortest route assuming ideal conditions. That is, assuming there are no traffic jams. But if you'd rather not end up in a swarm of freshmen on your way from the cafeteria to math class, we need to think a bit further.
Until now, we’ve used fixed values as weights (walking times based on average speed). But during the NETWORKS masterclass, we were introduced to a new idea: delay functions. A delay function is a dynamic weight: it gives the walking time for a route segment as a function of how many people are using it. More first-years? Longer walk time. Since crowd levels change the weights in the graph, the fastest route also changes accordingly. In other words: the program adapts to congestion!
A dive into the foundations of applied traffic theory led us to Kladek’s function, which describes the relationship between walking speed and crowd density. From that, we derived a formula that directly describes walking time as a function of the number of pedestrians.
This is the model proposed by Kladek (1966) to describe the relationship between density and speed in a flow:
\begin{equation}
v = v_f \left(1 - e^{-\gamma\left(\frac{1}{k'} - \frac{1}{k'_\text{jam}} \right)} \right)
\end{equation}
The variable is the actual walking speed, and is the free-flow walking speed (the speed when there’s no one else around you). The variable is the density of a flow, and is the density at which the flow comes to a complete stop, in other words the point at which it's so crowded that no one can move anymore.
We know that the density of a flow is given by:
\begin{equation}
k' = \frac{n}{x \cdot y}.
\end{equation}
Here, [] is the number of people on an edge, [] is the width of the edge, [] is the length of the edge.
The weight of an edge is the time it takes to walk that segment. With constant walking speed, that is:
\begin{equation}
w = \frac{y}{v_\mu}.
\end{equation}
In the case of pedestrian flows, the free-flow speed is equal to the average walking speed:
\begin{equation}
v_f = v_\mu = 1.34\ \text{m/s}.
\end{equation}
In our extended model, the walking speed changes. So we no longer calculate weights using , but using . Instead of talking about weight, we now refer to the delay on edge with pedestrians on the segment:
\begin{equation}
\begin{split}
L_e(n) = \frac{y}{v} &= \frac{y}{v_f \left(1 - e^{-\gamma\left(\frac{1}{k'} - \frac{1}{k'_\text{jam}} \right)} \right)} \\ &= \frac{w}{\left(1 - e^{-\gamma\left(\frac{xwv_f}{n} - \frac{1}{k'_\text{jam}} \right)} \right)}.
\end{split}
\end{equation}
Note that in the final step, we substitute with and recognize the formula for the original weight of the edge. We also substitute . This is how our delay function was derived.
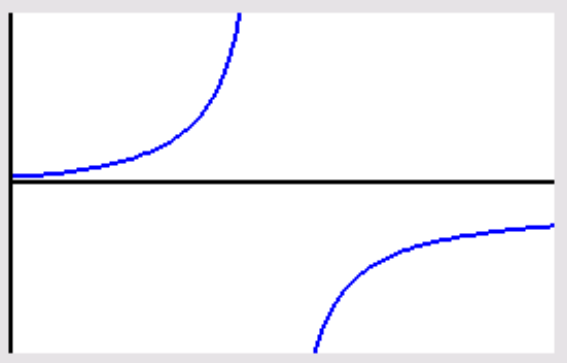
Below is a graph of the function above:
However, we notice that if the density of a flow exceeds the maximum, the delay becomes negative. Furthermore, the delay is undefined when . So we need to add a few exceptions to the formula. The final formula is:
\begin{equation}
L_e(n) =
\begin{cases}
w & \text{if $n = 0$,} \\
\frac{w}{\left(1 - e^{-\gamma\left(\frac{xwv_f}{n} - \frac{1}{k'_\text{jam}} \right)} \right)} & \text{if $0 < n < xwv_fk'_\text{jam}$,} \\
\infty & \text{if $n \geq xwv_fk'_\text{jam}$.}
\end{cases}
\end{equation}
[] is the number of people on an edge [] is the delay on an edge [] is the width of the edge [] is the length of the edge [] is the weight of the edge [] is the flow density, with as the maximum density (a constant)
Besides delay functions, we also need to consider the Nash equilibrium, but what is that exactly?
Imagine all the people of Amsterdam suddenly decide to take a day trip to Leeuwarden. The two most obvious routes are via the A6 (through Flevoland) or the A7 (over the Afsluitdijk). Of course, not everyone would take the A6, because it would be completely jammed, and not everyone would take the A7 either. In reality, traffic tends to settle into a balance where both routes take the same amount of time, and no one would benefit from switching to the other route. This situation is known as the Nash equilibrium, and the corresponding flow of traffic is called the Nash flow.
In a simple case with just two routes and a single start and end point, this equilibrium can be calculated using basic algebra.
A path (or a route) between a start point and an end point is an ordered list (or vector) of connected vertices, such that no vertex appears twice in the list. A subflow is a value between (and including) 0 and 1 that is assigned to a path.
To each path from to , we assign a subflow denoted by .
All subflows together, say there are of them, form the flow:
\begin{equation}
f := (f_{P1}, f_{P2}, \dots, f_{Pk}).
\end{equation}
An important condition is that all these subflows add up to one:
\begin{equation}
\sum_{f_{Pi} \in f} f_{Pi} = 1.
\end{equation}
A delay function assigns a positive real number (which represents the delay) to the subflow. We denote the delay over edge when subflow passes over that edge as .
The total delay over a path is the sum of the delays of all edges along that path:
\begin{equation}
L_{P_i}(f_{P_i}) = \sum_{e \in P_i} L_e(f_e).
\end{equation}
For the Nash flow, the delay is equal over every path, so we have:
\begin{equation}
L_{P1}(f_{P1}) = L_{P2}(f_{P2}) = \dots = L_{Pk}(f_{Pk}).
\end{equation}
An important remark about these definitions is that we assume the paths have no overlapping edges. If they do overlap, the mathematical definitions become more complex to obtain the correct results. Do you see where things go wrong in the case of overlapping paths?
Consider the following network and the corresponding delay function of each edge:
As an exercise, let’s calculate the Nash flow between and . We see that there are two paths from to , namely and . The Nash flow will therefore consist of two subflows, each traveling along one path: . Within a Nash flow, no one benefits from switching paths. The total delay over both paths must be equal: . To find the Nash flow, we need to find the flow that ensures the delays on both paths are exactly the same. Since there are only two possible flows that sum to , it follows that if then . By substituting this into the delay functions of the graph, the following equation can be derived: \begin{equation*} x + \frac{1}{16} = \frac{3}{4} + (1 - x)^2. \end{equation*} Given that , the solution can be found. Hence the Nash flow is
Flows also move through our school building, but finding a Nash flow here is a bit more complicated:
To start with, we have dozens of start and end points with dozens of routes between them, which makes algebraic calculation much harder. Try, for example, to find the Nash flow in the previous example if you add an edge between and .
Moreover, the subflows (over the two possible routes in the example) are fractions that add up to one. The reason for choosing a representation of a continuous flow (real numbers between 0 and 1), instead of a discrete approach (integers), is that traffic flows usually consist of very many vehicles. In that case, the impact of a single participant is negligible, so it makes sense to talk about a fraction of the traffic. On the other hand, Hyperion Lyceum has only 859 students moving through the school in limited flows. A discrete approach is therefore more appropriate, but harder to calculate.
We also want to include a time element in the student flow. The flow of students should only occur during, for example, the time period between the end of one lesson and the start of another, but not during lessons themselves.
This leads us to an approach using simulation. We’re going to simulate the student flows and the jams they cause with a Python program.
The program we created continuously sends students out of their classrooms and lets them traverse the school to their destinations. Meanwhile, their presence in corridors and on stairs causes delays on those segments, which eventually (if many more students are walking there) results in traffic jams. These jams show up as higher weights because the walking time, for example on a staircase, increases due to the jam. These traffic jam graphs are used at the appropriate times, such as between two lessons.
But how exactly does this prevent us from ending up in a crowd of first-years? The traffic jam results in longer walking times over certain areas, so the weight of the corresponding edges are higher. These higher weights influence Dijkstra’s algorithm, causing the fastest route to change. The shortest route is no longer always the fastest route, as is the case in real life. With an alternative route, we avoid the crowd of first-years.
Our web app
We also created a website so that students can use our navigation system themselves. Think of it as a kind of Google Maps, but just for our school. You can try the website yourself too. We used free hosting, so loading times might be slow unfortunately. Give it a try here.
Building this navigation system was a complex but amazing project. We especially want to highlight our homemade flow model, which shows surprisingly realistic results! We also couldn’t have done this without the help of NETWORKS. Creating a user-friendly website wasn’t easy either. Will we ever have to report to school early again? Probably yes—but it won’t be because of the route!
This article was translated by the Network Pages from Dutch to English, with the help of ChatGPT. The original Dutch article can be found here.
In October 2025 a masterclass on networks and algorithms will again be organised by the mathematics research program NETWORKS. Teachers and school students at the level of VWO 5-6 are welcome to join this two-day masterclass, no specific prior knowledge is needed, only enthousiasm about mathematics!
During our teenage years, everything changes. It’s no surprise that our brain does too. But how do we make sense of this transformation? Is there a way to quantify it? Networks might just be the answer.
Rafael Prieto-Curiel is a mathematician and a faculty member at the Complexity Science Hub in Vienna, Austria. His research focuses on crime, mobility, migration and urban dynamics. We interviewed Rafael to learn about his story.
When we fight for limited common resources, our decisions will shape opponents’ responses and vice versa. What does mathematics have to say about such situations?


 and
and  . We see that there are two paths from
  and
and  . The Nash flow will therefore consist of two subflows, each traveling along one path:
  . Within a Nash flow, no one benefits from switching paths. The total delay over both paths must be equal:
  . To find the Nash flow, we need to find the flow that ensures the delays on both paths are exactly the same. Since there are only two possible flows that sum to
  , it follows that if
  then
then  . By substituting this into the delay functions of the graph, the following equation can be derived:
 , the solution
  can be found. Hence the Nash flow is
 and
and  .
.