Do you recognise the expression "six degrees of separation"? Through our relationships with others we are only six steps away from knowing anyone in the world.
Computational Social Science or Sociomaths
The notion that we can reach very many people through friends, and friends of friends, has been around for a while. In the 1960s a social psychologist, Stanley Milgram, conducted a field experiment which has since become very well known. He asked a few hundred people in the US to get a letter delivered to a target person: a complete stranger to them. However, they could not send the letter directly, but only send the letter to someone they did know personally, and whom they thought was somehow closer to the target than themselves. Each of the recipients was of course asked to do the same. You might think that no letter would ever reach the target, but in fact, many did.
When Milgram looked at the letters that arrived, he found that they had needed forwarding only about six times on average. Over the years this experiment has given rise to a lot of research into the connections between people, and quantifying the statistical properties of this worldwide web of personal connections: social network science. That research shows that, through our relationships with others we are, on average, really only six steps away from knowing anyone in the world.
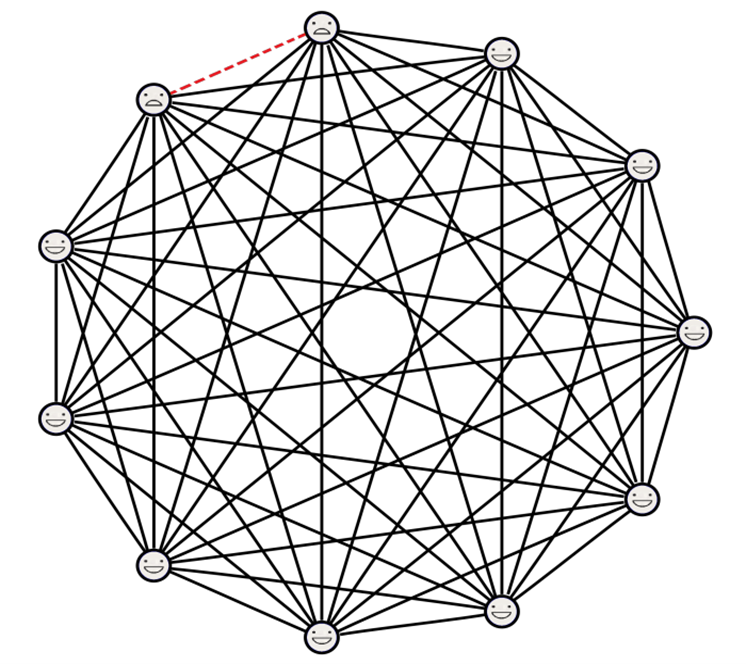
The idea of such connectedness has even made it into films. There is one from 1993 actually called "six degrees of separation", but the actual idea is used more centrally in "Pay it forward" from 2000. It is evident that who you know, and why you know them, is sociologically interesting in itself. However, I want to fan out from one central 'ego' and also look at friends of friends and their connections, and the variations in such patterns that exist. The shape and connectedness, or topology, of that network of the worldwide web of personal connections helps to understand a wide range of social phenomena.
This is true for what you might call the ‘smallest’ scales of the network: for instance, the number of links any person has, and how well linked each of this persons’ connections are with each other. It is also true when taking larger and larger neighbourhoods, i.e. links further and further away from any one person, where you may see that there are clusters of people all relatively well connected with each other, but less connected to people outside such a community. The mathematical properties of networks of connections (relationships) between nodes (people) helps a lot in understanding how a sense of belonging to a community might form spontaneously out of personal choices and circumstances. The spreading of epidemics, or fake news, or investment choices and associated flash booms and crashes all connect to this topology too (to read more on this topic I recommed the article Foundations of complexity economicsby William Brian Arthur). But, so do community support groups and social care and new romantic relationships.
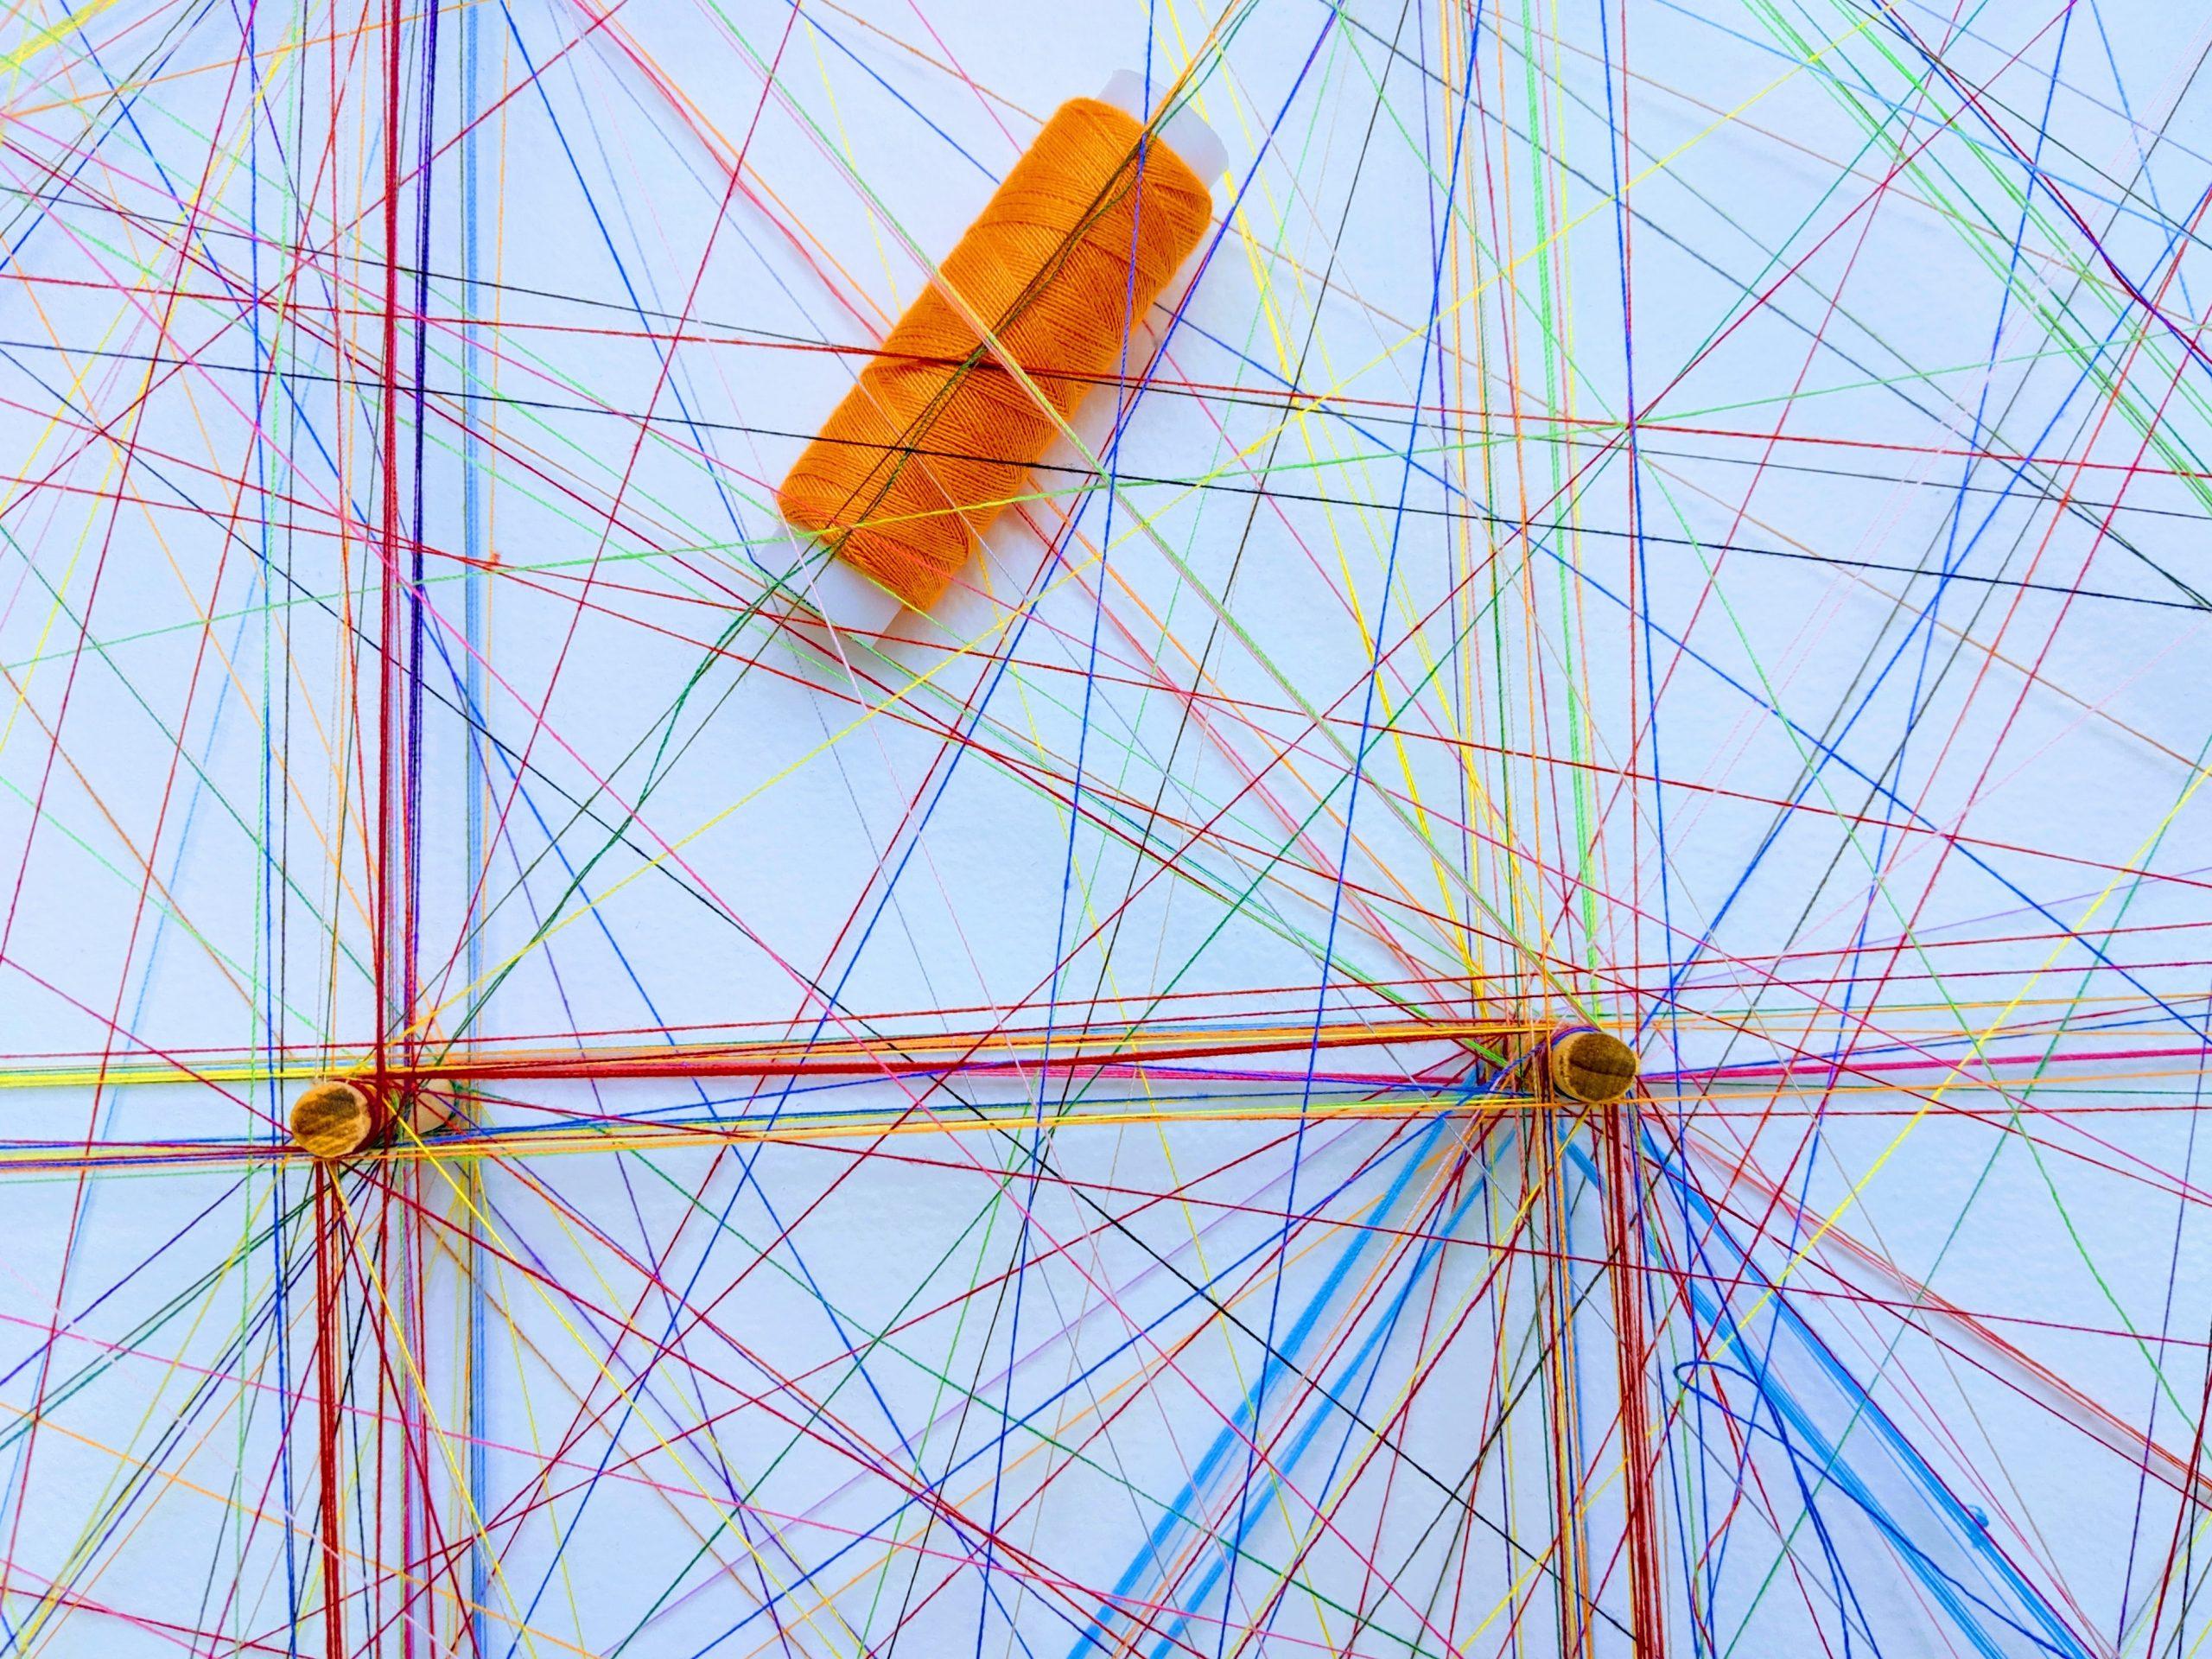
All these individual strands together make up the fabric of society. Phenomena like social cohesion and polarisation emerge from individual interactions on the social network of relationships between people. So, what does this network look like? There exist algorithms to identify clumps or cliques: within which everyone knows everyone, an example being the Leiden algorithm. Currently research is ongoing to attempt to measure how many of those there are in a country like the Netherlands.
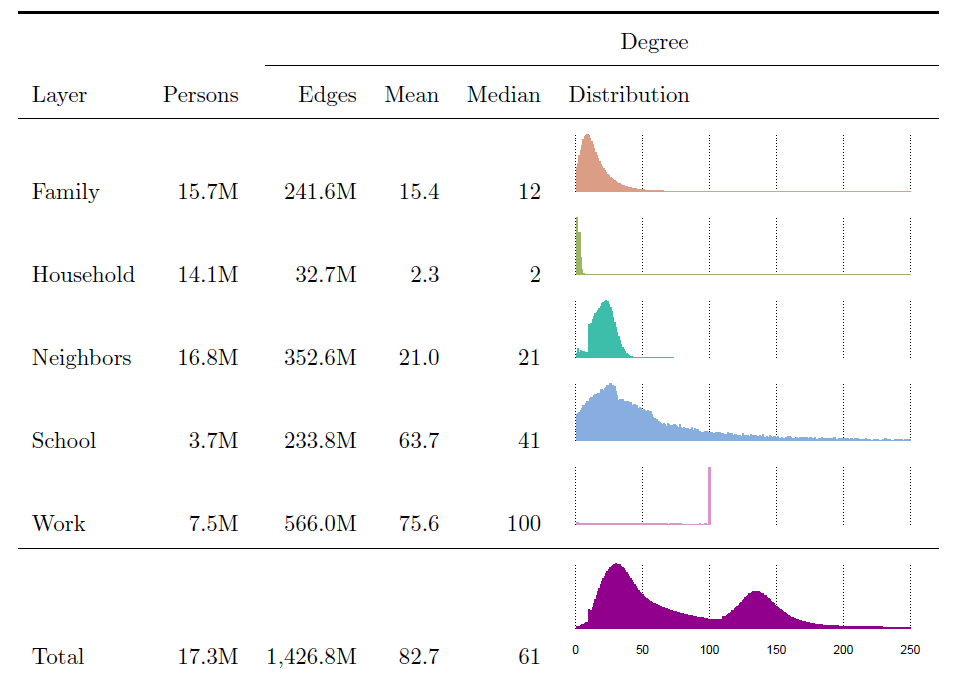
Even if six degrees of separation were the typical number, what is the variation around this? Attempts at measuring distribution functions of network links [2] show that the number of links any given person has in a social network (which is called its degree) is in fact very broad, with a peak somewhere between 20 and 30 links, a mean value around 82.7 but also with a long tail towards people having hundreds of links as well as there being many people with very few links.
Figure 1: The information on the number of relations per person (Edges, Mean, Median) and the corresponding distribution are shown for those persons that have the corresponding relation (column layer) with other persons (taken from [1]).
As a consequence, the number of steps required to go from one person to any other along such a network will have an enormous range as well. Clearly the answer to questions like these are about the mathematical and statistical properties of real-world social networks. The experiment of Milgram was the inspiration for a completely new field of research which combines sociology with computing and maths. Sociomaths is not in common use as a word, perhaps for good reason, but computational social science has definitely taken off.
Node characteristics, link directions, and weights
The simplest view of a network is that of nodes and links between those nodes. Nothing distinguishes individual nodes, and links are either there or they're not. Even in such a monochrome world there is plenty to explore. You could think of networks for which the number of links that every node has, is distributed according to a distribution function that looks much like a normal, Gaussian distribution function, or even a network where every node has exactly the same number of links attached to it. However, far more common is a distribution that is very different from these. From small scale studies as well as from larger scale research using various social media platforms, the distribution function is known to be very skewed and it behaves more like a power law: the majority of nodes has relatively few links, but there are a few nodes with really orders of magnitude more connections. This is a very interesting property, also because much less is known about how such networks respond to signals and information that has to travel over them, than networks with more uniform link distributions.
The situation gets even more interesting if you add some extra properties or characteristics to the nodes. People have different characteristics that are of interest to demographers and sociologists: age, gender, education, income, to name but a few. Each of these characteristics could be translated as properties of the nodes, sometimes encoded using colours. The mathematics of coloured networks with random connections is necessary to help to measure how mixed all of the colours are in the real network compared to random colourings or random networks. This means that segregation between groups is something that can actually be quantified properly.
Not only the nodes can have properties and characteristics, but the links in a network do too. Even something as simple as a family relationship, for example between a mother and daughter, or the relationship between an employer and an employee, has an implicit asymmetry. The directionality in the relationship between nodes has a profound influence on network dynamics. The branch of network mathematics that deals with networks distinguishes very clearly between directed and undirected networks for this reason.
The mathematics of sociomaths
Mathematically all the above is formulated in terms of the adjacency matrix. This is a large table which lists all of the nodes, both in the columns and the rows. Each entry in that matrix is either 0, if the node of the column and the node of the row are not linked, or 1 if the two are linked. For an undirected network that adjacency matrix is symmetric: if node is connected to node then is also connected to .
For a directed network this is no longer true: node might be able to pass information directly to node , but in a directed network, node might not be able to pass a signal directly back to . The adjacency matrix of a directed network is generally not symmetric. There is yet more to say about links in networks: some links might be used very heavily or imply very frequent contact or especially meaningful contact. This means that instead of filling that adjacency matrix with just 0's and 1's we can fill it with a weight, that expresses in some way how important the link is.
Not so small computing ...
Many of us have an account on a social media platform or even on several different ones. In some cases anonymised data on these social networks is even available for research. For someone interested in all of society, and not just the users of a particular platform, this is perhaps still a little disappointing. However, even if you can manage to get the data, it would still be a challenge to do some serious computing on it. Let's take a not very big country, like the Netherlands, with about million inhabitants. The adjacency matrix for that would have entries in it. If each entry takes 8 bytes of memory, (a weighted asymmetric adjacency matrix) then we are talking roughly thousand Terabytes of memory just to store it. Of course many entries are so there are good ways to reduce the memory requirements, but computational social science is clearly not doable on your typical home computer. And computing is definitely what you would want to do.
Given that it is a matrix we are working with, the entire toolbox of linear algebra (a field in mathematics) is open to us, to learn more about that matrix and so about the fabric of society. To name just one avenue: square matrices can be decomposed in a number of ways, including an eigenvalue or singular value decomposition. The eigenvalues, as many as there are rows (or columns) in the matrix, can be used in many ways to capture statistical information about the network and its shape: the number of cliques it has, the maximum number of steps any two nodes are away from each other, the signal speed over the network etc. For instance, the diameter of a network -- which translates as the number of steps required to go over the network between those two nodes for whom it takes the most steps to get from one to the other -- is related to the largest eigenvalue in the adjacency matrix. This is the kind of information I would be looking for if I were a demographer.
Normally, carrying out such decompositions requires a number of basic computing operations (additions and multiplications) that scales as where is the number of rows (or columns) of the matrix. Even with current generations of computers, that is some serious number crunching.
In practice
Outlandish? Perhaps you wonder whether the necessary connections data even exists, let alone ponder the point of pursuing such research. To the first I can give a definite affirmative: a handful of national statistical institutes, including the one of the Netherlands, has relevant data for all of its inhabitants in their safekeeping and does research with it (see Popnet for example, a digital community with the aim of providing social network data on the population of the Netherlands for academic research purposes). The point of pursuing it lies in the challenges that our society faces.
The social network also matters when it is combined with actual geographical distances, so that you can do the statistics of how far away people who are close links in the social network live from each other.
Another interesting result is that of segregation between people with different educational backgrounds: one of the measures of social segregation and social mobility. The social network that has been compiled by Statistics Netherlands actually distinguishes various layers (see Figure 1 above), depending on the context within which people know each other, such as family, household, school or other educational institution, place of work, etc. When each of the different layers are given an equal importance, the household layer on average increases the degree of segregation by education, which can be explained by the observation that people with similar levels of education in the Netherlands tend to associate more with each other. By contrast, work, neighbours and schools can provide greater exposure to individuals of differing educational backgrounds.
Also in the field of public health the networked character of social interaction plays an important role. The amount and intensity of contacts between people in different groups is of crucial importance in the spreading of infectious diseases. There are always some particular groups of people that are particularly vulnerable to exposure, such as was the case with HIV/AIDS, or who become more ill when exposed, such as the most elderly and people who are immunocompromised due to other chronic health conditions. Therefore it is important to measure the contacts between different groups in society. The Pienter study (in Dutch) of the Dutch National Institute for Public Health and the Environment (RIVM) is one approach to this by way of a detailed survey, which can of course be combined with less detailed but larger scale social network data of Statistics Netherlands. Participants (volunteers) in this study are asked to complete a (digital) questionnaire and to take a finger prick themselves and send a tube with blood to RIVM. In the laboratory, this blood is tested for antibodies against the coronavirus. The participants are asked to do this a maximum of 6 times in a year and a half. The questionnaire asks them to provide details about their movements and numbers and types of contacts with other people in the previous weeks.
Work is in progress to further improve the models for the spreading of epidemics, using such data. While this is a particularly timely application of social network science to health, there is other research into the influence of social network on the lifestyle of people living with diabetes, which is no less important on a longer timescale.
As the climate changes, so do we need to cope with this, in part by adapting how and where we live and interact with each other. At the same time, people have come to expect that governments be much more responsive to citizens' individual needs, as well as maintaining a grand vision of which direction society needs to take to achieve sustainable development goals (see the 17 goals of the United Nations on sustainable development). Policy makers will need new tools to support evidence based governance to meet these challenges. Governance is about the collective behaviours of members of society, and society is a complex construct which computational social science attempts to unlock and explore. You and I are not in a LAT-relationship and we may never even meet, but our life courses do intertwine in computable ways.
If, after reading the title, your immediate response is to shout "1/6-th", then you have correctly answered the question. Well done! However, in this article we will focus on the meaning of this question. What exactly is this "chance" of which you've just exclaimed it equals 1/6-th?
A conjecture of Erdős and Hajnal from 1989 says that forbidding any specific substructure results in existence of a very large homogeneous one! In this article you will have a look into one of the most fascinating problems in modern graph theory.
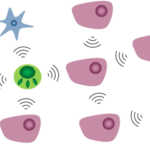
It is quite difficult to extract information from your body. Your body is so vast that millions upon millions of messages get sent and deleted every second. It is impossible to know exactly who said something. The doctor’s main challenge is finding a way to reconstruct the network of interacting cells given the limited information she can measure.
Have you ever found yourself less popular when compared to your friends? Interestingly, in any group of individuals, on average, people have fewer friends than their friends do, or at the very most, an equal number. Not more!
 is connected to node
  then
then  million inhabitants. The adjacency matrix for that would have
  entries in it. If each entry takes 8 bytes of memory, (a weighted asymmetric adjacency matrix) then we are talking roughly
  thousand Terabytes of memory just to store it. Of course many entries are
  so there are good ways to reduce the memory requirements, but computational social science is clearly not doable on your typical home computer. And computing is definitely what you would want to do.
 where
where  is the number of rows (or columns) of the matrix. Even with current generations of computers, that is some serious number crunching.