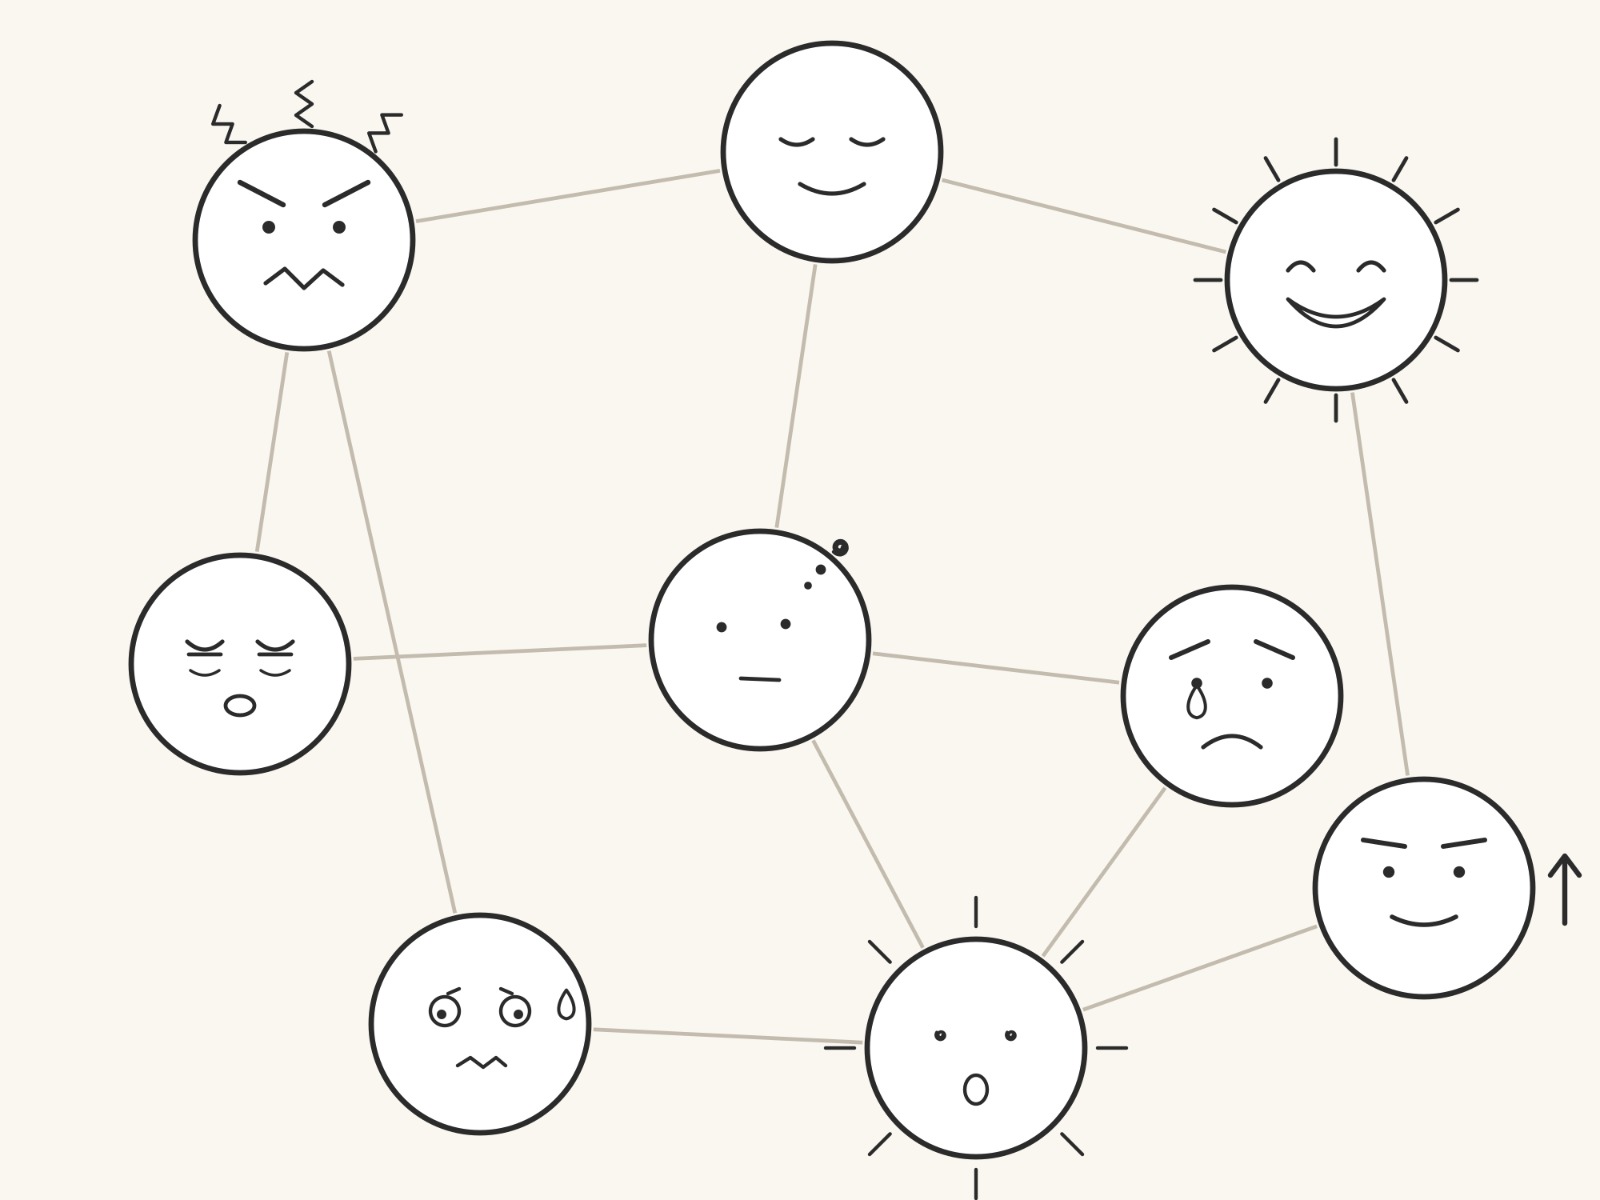
Tony is a middle-aged man with a wife, two kids and a good, albeit hard, job. At some point, the job gets very demanding and starts to stress him out, like a weight loaded on his shoulders. Tony feels like he should not talk about this, maybe because talking about feelings is uncommon among his male friends. So he decides to stay silent about it all. This self-imposed isolation gradually makes him less social, worsens his relationships, makes him more easily irritated and hinders his sleep. All of these consequences worsen the situation, the lack of sleep aggravates his temper, which impacts his social life and his performance on the job, putting more weight on his shoulders, ultimately sending him spiraling into panic attacks. Once he reaches this low, Tony gets in contact with a psychiatrist who prescribes him medicine to treat his condition.
Tony suffers from depression, a very common mental disorder that impacts millions of people around the world. But what is depression? Is it an illness that can be treated and medicated, like the flu or lung cancer? Do its symptoms come from a particular source, akin to a virus or tumor? Tony’s example begs to differ, as it seems to have been started by a group of events. His suddenly increased workload affected different parts of his life, leading him into a vicious feedback loop, which culminated in his panic attacks.
This perspective shows depression, not as a group of symptoms caused by some underlying independent cause, but as a self-sustaining interaction between symptoms activated by external events.
This type of interaction can inform us on the behavior of the disorder. How does it develop? How does it sustain itself? Where can it be attacked? These questions cannot be adequately addressed when treating a disorder as a latent variable.1 The between-symptom relations can give us clues or even answer them. In order to study them, it helps to represent them as networks of interacting symptoms, giving rise to the name “the network approach to mental disorders”.2
Throughout the 2010s and especially the 2020s, researchers in psychology and psychometrics have become increasingly interested in this network approach. They hope to deepen our understanding of mental disorders and find treatments or other applications through networks. The Netherlands have become a hub for this kind of research. For example, some of the pioneers in this field work in the University of Amsterdam3, University of Leiden4 and Tilburg University5. Over the years, there have been various conferences, seminars and courses on this exact topic, showing its relevancy and potential.
What would such a network look like? Usually, a group of variables related to the mental disorder is taken as the nodes. This could be symptoms such as ‘feeling down, hopeless’, ‘being tired, unenergetic’ or ‘having trouble concentrating’, but it could also be moods: ‘irritated’, ‘excited’, habits: ‘exercising’, ‘alcohol use’ or even some external stimuli, depending on the application. Let's look at an example:
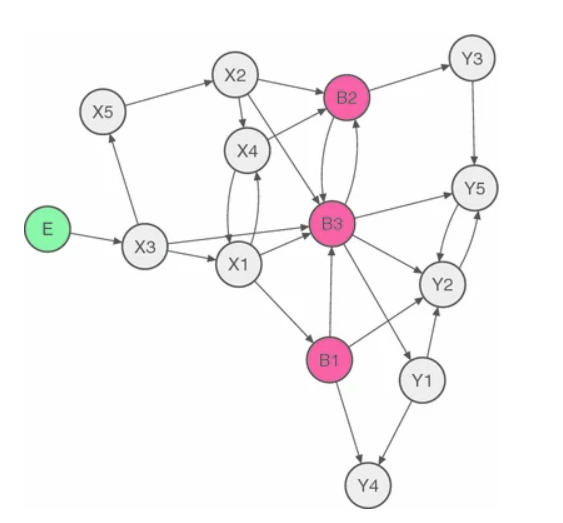
Here, there is a green node 'E' that represents an event. There are symptoms of a mental disorder 'X'. These nodes are marked 'X1', 'X2', and so on. There are also the symptoms of mental disorder 'Y', named 'Y1', 'Y2' et cetera. Finally, there are three symptoms 'B1, 'B2' and 'B3'. These are symptoms shared by both mental disorders and they are called bridge symptoms. The example comes from a review by Elko Fried.
An arrow signifies a relationship between two nodes. Let's look at the arrow from symptom X3 to X5. It signifies that a change in severity of X3 tends to be observed some time before a change in severity of symptom X5. So, if the severity of X3 changes, it suggests that the severity of X5 might change soon after. More mathematically, a change in X3 at timestep is correlated with a change in X5 at timestep .
In a real network, each edge carries a value indicating the intensity and direction of this relation. The edge (X3 X5) being negative and with high intensity would tell us that the two symptoms have an inverse relation, an increase in the severity of X3 is strongly correlated with a decrease in the severity of X5 in the future.
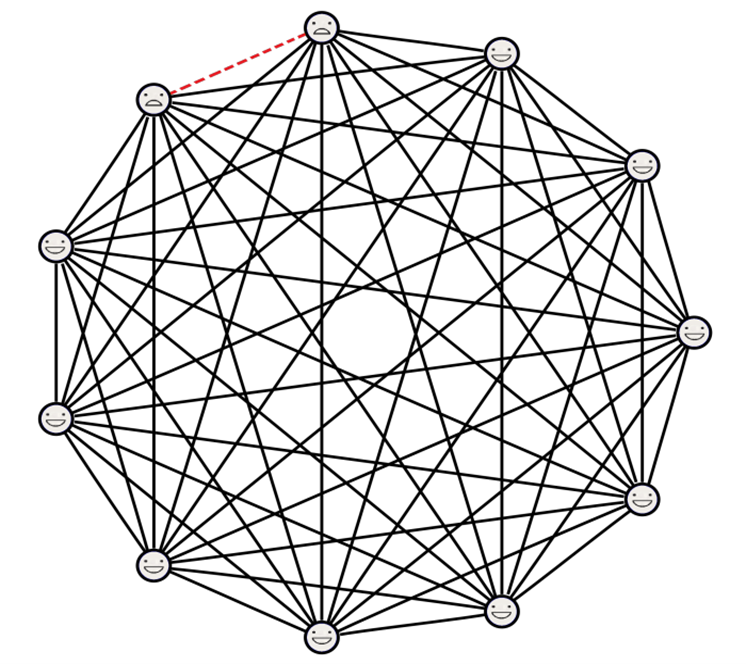
In the network approach to mental disorders, this network is inferred from data. To construct such a network from data, it is necessary to record information about symptoms over time. If such data is unavailable (it can be difficult to gather information about symptoms over time), another kind of network can be created: a network where we do not have arrows, but simply line segments. These line segments between nodes, also called edges, do not have a direction and simply indicate if two symptoms are likely to coexist in a person.6
The coexistence of symptoms in an individual is called comorbidity. Anxiety and depressive disorders have a high comorbidity risk and they share similar symptoms and characteristics, namely 'difficulty sleeping, difficulty concentrating, being easily fatigued, and psychomotor agitation'.7 They are differentiated by low mood and apathy in depression and uncontrollable future worry in anxiety. The network approach has been used to study their relationship.8 One may still ask: is there a causality between the two? And what are the consequences of experiencing both at once? How should patients with one disorder be treated to avoid the development of another? These questions can be addressed using the network method by studying bridge nodes or arrows connecting two disorders like in the example depicted earlier.
In that example, we can see how the bridge symptoms can help explain this coexistence through their impact on the rest of the disorders. An activation of disorder X can increase the severity of the symptoms B which can then activate symptoms of Y. Comorbidity is a very notable case where the network approach has been able to explain empirical findings not supported by earlier theories. Specifically, a model that treats mental disorders as unknown variables causing symptoms cannot readily explain why individuals who already have one mental disorder are at increased risk of developing another.8
One aspect that researchers have focused on is the importance of certain symptoms in the network. Which symptom has the biggest effect on the rest of the network when it varies, for example? Or: which symptom acts as a facilitator for the spread of negative symptoms? There are different ways to answer such questions, but the network approach offers useful interpretations. For instance, a symptom could be deemed important if it has the strongest connections with the rest of the network. That idea is embodied by the node that points to the most symptoms.
Another approach is to look at which nodes are often "intermediate stops" when going from one node to another in a network. Consider again the example above. To go from X3 to X4, there is a path from X3 to X5, then to X2 and then to X4. But the shortest path is X3 X1 X4. In the shortest path, only X1 is an intermediate node. If X1 is an intermediate node very often, meaning it is in the shortest path between many different nodes, it may be considered important. How often a node is an "intermediate stop" in shortest paths is called its betweenness centrality, because nodes with high betweenness centrality are often "between" other nodes. In practice, we do not only look at the number of connections that a node has, but also factor in the weight/intensity of these connections. Many other centrality measures exist that tell a different story about the importance of a node, some of which are discussed in this Network Pages article. This kind of symptom-specific analysis can be used to understand important parts of mental disorders and develop treatment strategies9
One of the largest studies on this topic is the WARN-D project. The goal of WARN-D is to build an early-warning system for depression, building tools that suggest how to identify the people that are most at risk and suggest proactive treatment to avoid the (further) development of depression. Data has been collected from 2000 students who filled out 4 short surveys every day for 3 months, which probed the state of mind of each individual, some larger surveys at the end of the day and the week and some biometric data using a smartwatch. This period of heavy data collection is followed by follow-up questionnaires every 3 months. The study aims to understand the development of signs of depression by zooming in on the life of each individual. Through this examination, the project aims to find commonalities between individuals who develop high levels of depression during the follow-ups. A big part of the data was collected in a way that allows for network analysis, with the goal of finding network-based markers for the development of the disorder.
The richness of the data collected over time by WARN-D allows for the creation of separate networks for the surveyed individuals. For instance, the ten variables (Sad, Stress, Overwhelmed, Nervous, Ruminate, Irritable, Tired, Cheerful, Motivated, Relaxed) representing different effects can be taken as the network's nodes. To connect them, one can investigate how the values of the nodes influence each other over time. A model that estimates such connections is Vector AutoRegression (VAR), which explains the value of a variable using the values at the previous time-step (in this case, survey), identifying how impactful each variable was in that change. This method results in a complete, weighted and directed network which informs us about the potential impact that each state has on the future. Notably, it gives an indication of how a person’s mental state may develop and how stable it is. Below is a real example of a network produced through this method:
The self-loops are an interesting indication of the rigidity of each state and allow us to see that sadness is very likely to persist whereas motivation is not for this particular person. Strong ties are also very informative. We see that when this person ruminates at a certain point of the day, they are less likely to be nervous or overwhelmed later.
One way of measuring the effect of nodes on each other over time is applying a linear regression between the values of a variable and the time-shifted values of another variable. The time shift can be taken as the time between question sessions, also called beeps. This can be repeated for all of the ordered pairs of variables. The results of all of these regressions can then be presented as vectors and matrices for the sake of compactness. The final outcome of this procedure is a type of Vector AutoRegression (VAR), of the form \begin{equation} X_t = B X_{t-1} + \varepsilon_t, \end{equation} where is the vector of variables at time , is the vector at the previous time step, is a matrix of coefficients and is the vector of errors accounting for the difference between the values expected from the discovered relationships of the variables and their actual values at time . In this specific VAR implementation, the offsets of the variables are sidestepped by shifting the variables so that their means are . The elements of matrix can be regularized to account for different slopes obtained from the regressions. These values can then be used as the edge values representing Partial Directed Correlations, or how strongly one variable influences another on the next time step.
From the created network, we look for information that could be used as a marker for early signs of depression. For instance, it has been hypothesized that high positive self-loops in key states (Sad, Ruminate) show emotional inflexibility and could be a sign of depression.10 The stability of the patient's state of mind is also interesting when it comes to predicting depression. High instability in emotions and a tendency to go back to negative loops could be a sign to look for. Regarding the network, it has been hypothesized that strong connections between variables could lead to quick spreading of changes in their values. Lastly, one can study the effect of specific symptoms. If we are interested in which symptoms have the greatest impact on the network when they vary, then we can consult the importance of the nodes. As we have seen, this importance can be estimated through centrality measures.
Let us revisit Tony's fictional example with such centrality measures in mind. We follow Tony for three months and create a network describing the relations between his moods. We see that when something happens that stresses him, he very quickly gets anti-social, irritated and many parts of his life are very quickly impacted. The effects of the event are thus sustained long after the event itself. This indicates a large strength in the network as any sudden change in one of the symptoms quickly affects the rest of his life, kickstarting bad habits and reactions. In particular, such chains of reactions always start or get amplified when Tony gets bad sleep, or when he gets nervous. Seeing that these nodes strongly influence the rest of his network we know to give them particular attention. An even more interesting option is that if Tony had been followed like this before the onset of his symptoms, these potential pitfalls could have been noticed in advance. They could have been addressed and Tony would have had a better awareness of what behaviors or situations to avoid to keep himself in a good state. The hope is that such awareness could help Tony prevent the situation from worsening.
By the recency of the developments, this field of research is still at a relatively explorative phase. Especially when it comes to very large datasets and time-series data, the methodology to create and analyze the networks is still being researched.11 There is not a single way to create a network or a group of nodes that is currently standardized across the field. In order for the results to be reproduced and a theory to be developed there needs to be a more standardized methodology that, currently, we do not have.
The network model for mental disorders is still a relatively new and exciting tool to expand our understanding of what they are and how we can treat them. Ultimately, different disorders behave differently in different people. It is impossible to decide on treatment or diagnosis purely using statistical tools without grossly disregarding context and mishandling thousands of cases. We do not see this approach as the absolute truth of how mental disorders work, but rather as a statistical tool that can give us information that we might have disregarded in the past, hopefully helping in designing more successful treatments and adding more pieces to the puzzle that are mental disorders.
A latent variable is a hidden, unobserved variable that causes the observed data. In this context it is a hidden mechanism that causes the observed symptoms of the disorder. ↩︎
During our teenage years, everything changes. It’s no surprise that our brain does too. But how do we make sense of this transformation? Is there a way to quantify it? Networks might just be the answer.
Have you ever found yourself less popular when compared to your friends? Interestingly, in any group of individuals, on average, people have fewer friends than their friends do, or at the very most, an equal number. Not more!
When we fight for limited common resources, our decisions will shape opponents’ responses and vice versa. What does mathematics have to say about such situations?
Rafael Prieto-Curiel is a mathematician and a faculty member at the Complexity Science Hub in Vienna, Austria. His research focuses on crime, mobility, migration and urban dynamics. We interviewed Rafael to learn about his story.


 is correlated with a change in X5 at timestep
  .
. X5) being negative and with high intensity would tell us that the two symptoms have an inverse relation, an increase in the severity of X3 is strongly correlated with a decrease in the severity of X5 in the future.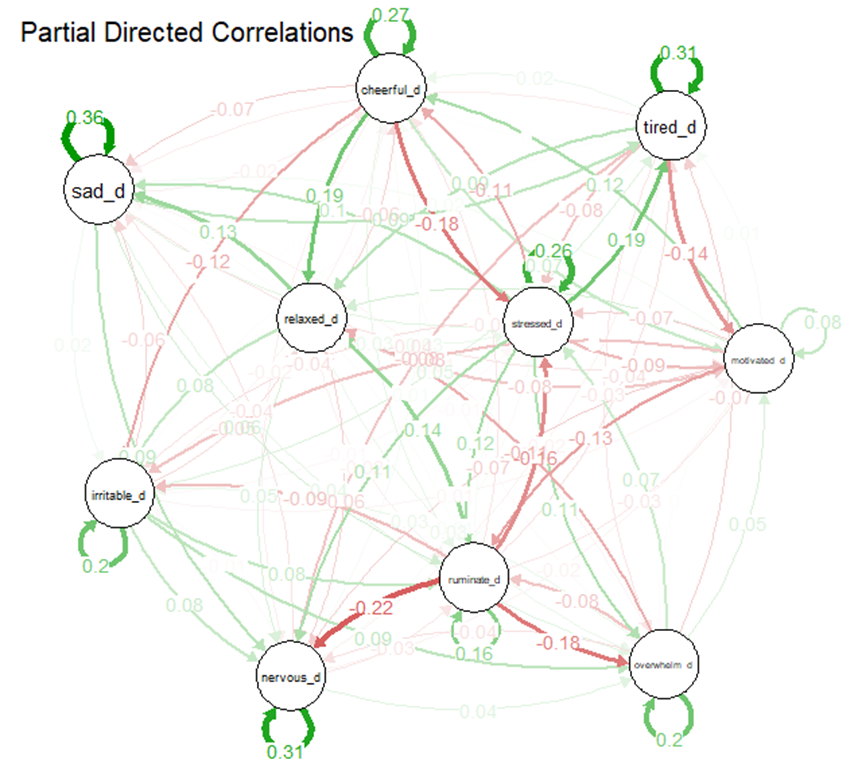
 is the vector of variables at time
  is the vector at the previous time step,
  is a matrix of coefficients and
  is the vector of errors accounting for the difference between the values expected from the discovered relationships of the variables and their actual values at time
  . The elements of matrix