In his, now classic, 1960 article “The Unreasonable Effectiveness of Mathematics in the Natural Sciences”, physicist Eugene Wigner shares the story of two former classmates, one of which became a statistician and was now working on population trends. As the story goes, the statistician attempted to explain part of his work to his high-school friend, only to receive his utter disbelief as to what the recurring letter meant; “Surely the population has nothing to do with the circumference of the circle.", the friend said boldly.
Wigner goes on to express the opinion that mathematical theories often find applications far beyond the scope for which they were developed, something which he claims to be unreasonable. Challenging Wigner’s idea, some scientists have argued that perhaps we live in a world that is purely mathematical, and therefore mathematical theories simply attempt to approximate it. I tend to sympathize more with the latter theory, not because I have some compelling evidence for it, but rather because the idea of a mathematical world is more beautiful in my mind; mathematical structures are already out there and our goal is to discover them.
One of the many mathematical theories that can approximate, or many times exactly model, real-world problems is the theory of graphs. A graph is a mathematical structure that is used to model pairwise relationships between objects. Objects are abstracted as so-called vertices and related pairs of vertices are connected by edges. For example, the so-called family tree is a type of graph we are all familiar with (pun intended). In your personal family tree, you are a vertex that is connected by edges to your parents and your children (if you have any). A tree is a very typical type of graph and is defined as a graph that has no cycles. That basically means that there is a unique way to travel between two vertices of the graph; starting from your grandfather, there is only one way to travel to your vertex, which is going through your parents and that is the only way possible.
A cycle is also a typical kind of graph. Being able to detect cycles in a graph is very crucial for applications. For example, let’s consider the graph where vertices are bank accounts and an edge between two accounts corresponds to a transfer of money between them. A large cycle in this graph could indicate an attempt at money laundering; a significant amount of money starts from a source and goes through various other bank accounts before eventually returning to the source.
In this article, we will see how coloring the vertices of a graph can be proven useful in various scenarios. In the left picture below, you can see a cycle graph with five vertices. Imagine now that I asked you to color the vertices of this graph in such a way that no two connected vertices share the same color. Of course, you could simply choose a different color for each vertex and that would work. But now let’s say that I asked you to use as few colors as possible. After trying, you will see that with two colors it’s not possible to do it, but three suffice as shown below in the right drawing.
Given a graph , the smallest number of colors you can use to color its vertices, such that no two connected vertices have the same color, is called the chromatic number of , often denoted by . In the previous example, we have . It turns out that many real-world problems can be formulated as graph-coloring problems which makes it easier to solve them by using existing algorithms. In what follows we will see some of these examples.
Let’s say that we want to schedule final exams for various computer science courses, which we will name . Some students follow multiple courses and will need to take multiple exams. This means that we can’t schedule those exams at the same timeslots, so then the question is: how many different timeslots do we need to schedule the exams?
To answer this, let’s first assume we know that the following pairs of courses have students in common:
Even if we have this information, it seems hard to figure out the answer without any visualization. As we will see now, we can rewrite this problem as a graph coloring problem, which we can solve quite fast!
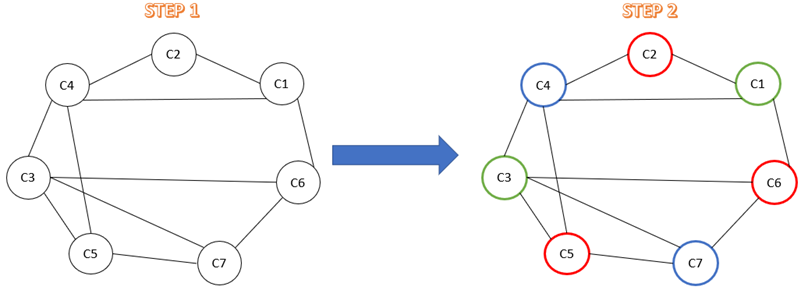
We take the following two steps: (1) create a graph where each vertex corresponds to one of the courses and connect any two courses for which there are common students, (2) find the chromatic number of the resulting graph. Below you can see these steps in action:
You may wonder of course how to do Step (2): one easy way is to observe that the resulting graph contains cycles of length 3: for example C1,C2,C4. Therefore 2 colors are not enough. Upon trial end error you can see that three colors are indeed sufficient. This in turn means that we need three timeslots to schedule the exams.
The same principle as above can in general be applied to problems where we want to split objects into a minimum number of groups and we have some constraints which tell us which objects cannot be grouped together. Try to see why this is true, for example, for the game of Sudoku. How can you model this as a graph coloring problem? How many vertices are there and what are the constraints?
One of the big advantages of seeing such problems in this light is the fact that they then can be solved by already existing algorithms for graph coloring. Note that graph coloring is a hard computational problem, meaning that the time needed to compute an optimal solution grows exponentially with the size of the graph. There are however various algorithmic techniques that offer significant improvements over methods based on brute-force enumeration. The interested reader can refer to Chapter 4 and Chapter 5 of the Guide to Graph Colouring by R. M. R. Lewis.
In this article, we mainly focused on practical applications of graph coloring, but in mathematics, it’s common to study problems that are completely abstracted from the real world. I even dare to say that the more abstract a problem is, the greater the gratification of the mathematician that solves it. And the reason for that is simple: abstract problems are often the hardest to solve. In the next article of this series on graph coloring, we will take a look into such a problem, which is defined on an infinite graph; can you get more abstract than that?
A mathematician once told me that problems that are very simple to state can be very deceiving, and sometimes turn out to be extremely difficult to solve. One such problem was the Four Color Problem.
Rafael Prieto-Curiel is a mathematician and a faculty member at the Complexity Science Hub in Vienna, Austria. His research focuses on crime, mobility, migration and urban dynamics. We interviewed Rafael to learn about his story.
Ever wondered how stolen necklaces are tactfully divided? Join us on a captivating journey into the math under necklace splitting! This journey will lead us to a wonderful and very important theorem in mathematics, the Borsuk-Ulam theorem.
During our teenage years, everything changes. It’s no surprise that our brain does too. But how do we make sense of this transformation? Is there a way to quantify it? Networks might just be the answer.
 meant; “Surely the population has nothing to do with the circumference of the circle.", the friend said boldly.
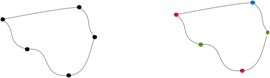
 , the smallest number of colors you can use to color its vertices, such that no two connected vertices have the same color, is called the chromatic number of
  . In the previous example, we have
  . It turns out that many real-world problems can be formulated as graph-coloring problems which makes it easier to solve them by using existing algorithms. In what follows we will see some of these examples.
 . Some students follow multiple courses and will need to take multiple exams. This means that we can’t schedule those exams at the same timeslots, so then the question is: how many different timeslots do we need to schedule the exams?