Steel industries work with universities trying to understand how microstructure features influence the properties of metals.
When we think of metals, we usually imagine very strong materials. Imagine holding a piece of steel in your hand; it’s cold, heavy and it has a smooth surface. Then try to bend it, probably it’s stiff and tough. Hit it but it is resistant, it does not break.
Steels are incredibly diverse materials used in many different applications, ranging from cutlery and thermal bottles to automotive, construction, and nuclear industries. They have many different mechanical properties and depending on their final use, we might prefer strength over ductility, elasticity over plasticity, or maybe a good balance between them.
Since their discovery, men have tried to improve the properties of metals. Think of the blacksmiths forging a sword. While heating and hitting the sword, they make the material stronger and sharper. This is one way to modify the mechanical properties of metals, but not the only one. Moreover, besides strength, there are also other mechanical properties, like ductility or elasticity, we would like to be able to modify, depending on the application.
Steel industries, nowadays, use different processes such as cooling, heating, bending, and stressing of the materials, for different durations, and at different intensities, aiming at modifying and improving their properties. For industry, it is very important to understand what are the factors that make steels stronger or more flexible.
All the industrial processes mentioned above cause immediately visible modifications in the material, such as increased strength or flexibility, but they also cause modifications in a deeper level of the material, at the microstructural level. Metallic microstructures are made of cells (grains), arranged in beautiful geometrical shapes (see Figure 1).
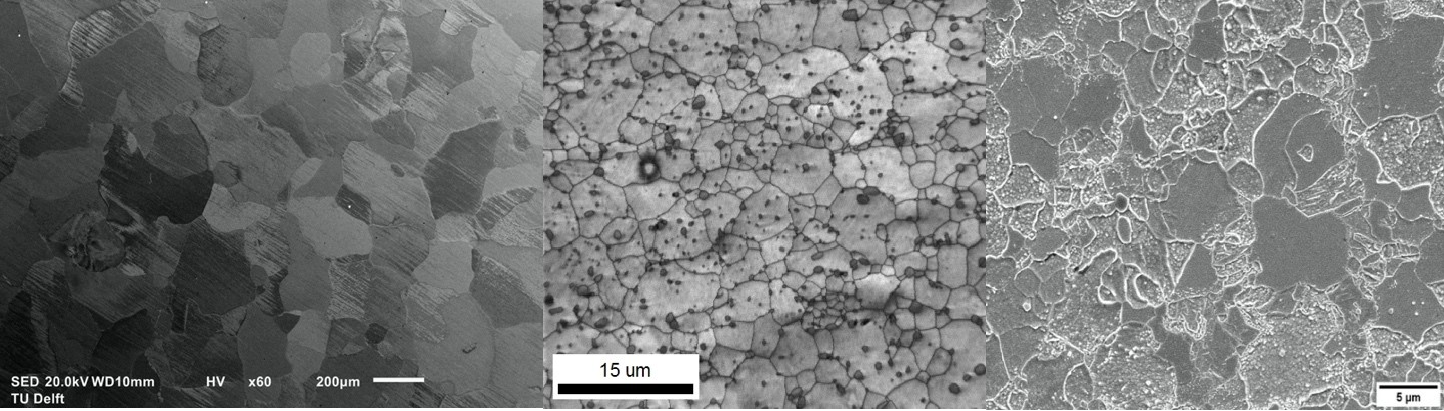
Figure 1: (a) Single-phase steel microstructure, (b) AISI stainless steel with M23C6 carbides precipitation (two phases), (c) ODS (Oxide Dispersion Strengthened) Eurofer steel (Pictures taken by Wei Li, Javier Hidalgo, Viviam Marques Serra Pereira).
The size, shape, the type of the grains, but also the phases and their defects are features that can influence the final mechanical behaviour of the material.
A clear example that shows the close connection between the size of the grains and their mechanical properties is that of the yield strength. Named after its inventors, the Hall-Petch relation says, loosely speaking, that the smaller the grains are the stronger is the material. But is there another microstructure feature that can give even stronger materials? Yes, and the answer is shown in Figure 1(b) above and will be discussed later on. While Figure 1(a) might be familiar to some of you, even if you have never read about this topic before, this is less likely with the more exotic one in Figure 1(b).
Steel industries work in close contact with universities trying to understand how microstructure features influence the properties of materials. In this way, they can implement processes that modify their structure and consequently obtain new steels with desirable properties.
This is the goal of the project “DENS: Digitally Enhanced New Steels Product Development”, in which Tata Steel Europe, Delft University of Technology, Eindhoven University of Technology, University of Twente, and the Max Planck Institut für Eisenforschung, work together to develop models to relate microstructure features with mechanical properties.
In particular, researchers with different backgrounds, ranging from material science and physics to mathematics and statistics, team up to digitalise all the phases of steel production. This digitalisation literally corresponds to translating all the steps needed in steel production to programming language so that a computer can run virtual experiments, which are the digital counterparts of physical experiments in a factory or a lab. The result of this digitalised process is statistical in nature, but it can be translated back to a result about actual materials. The goal of this endeavor? To shorten time and costs in steel production and to increase its accuracy. I am a postdoctoral researcher in DENS and I will now guide you through this process of digitalising steel production. Let’s consider a specific example.
Suppose Tata Steel wants to create steels with specific yield strength. As we said before, the Hall-Petch relation says that smaller grains yield stronger materials. But there is another way to increase the strength of materials, namely using a technique called precipitation hardening, don’t bother too much about the exact meaning of this term. Just keep in mind that carbides precipitation results in the small dark particles as in Figure 1(b). The question now is, how can we evaluate and measure the effect of carbides precipitation on material strength? We can try to answer this question using a classical approach based on physical experiments or… we can use a virtual statistical approach!
In any statistical analysis, the first thing to do is gather the data. In physical experiments, we collect data from material samples. Material samples, or specimens, need to be sectioned, mounted, course grinded, polished, etc. We need all these procedures to be able to accurately observe the material using optical and electronic microscopes.
The results are beautiful images as shown in Figure 1 above. These images are material data. In physical experiments, collecting material data can be both time- and cost-demanding and problems can occur. First, most information about a material is based upon two-dimensional (2D) observations. But metals are intrinsically (3D) three-dimensional objects. So, the information is incomplete. Also, measurement accuracy plays a role. Each instrument or tool we use has a specific precision but also limitations. Furthermore, it is impossible to find materials that differ just in one microstructural parameter. Steels can present more or fewer carbides precipitates but they will present also other diversities that can be responsible for variation in the mechanical properties.
In virtual experiments, we generate data. We create “digital twins” of the steel microstructure. One way to do it is by using a mathematical model called Voronoi diagrams.
Voronoi diagrams are referred to as the state of the art for modeling the arrangement of the grains in metal microstructures. In fact, the generation of Voronoi diagrams resembles pretty well the formation of metallic microstructures and in particular of their grains. We can get an idea of their formation by looking at the gif in Figure 2. Suppose we throw some points called generator points or sites (black points in Figure 2) on a plane. Then, we let circles with the sites as centers grow at the same time and the same speed. Every time two circles touch a line between two circles appears. The final result is a partition of the plane, in which every region is called a cell. The same holds in 3D, where the plane is a finite volume, the circles are balls and the line between two balls is the face of the cell.
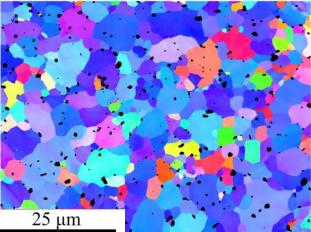
For our specific example, we need to create a digital twin of steel with carbides precipitates. An image of such a material taken with a microscope where we have colored the cells depending on their orientation is shown in Figure 3. Unfortunately, in practice, the classical Voronoi diagram may appear a too simplistic model. Using a Voronoi diagram the closest you could get to the microstructure shown in Figure 3 is the microstructure without the “black spots”, which are the carbide precipitates, and thus the essential aspect of the material you would like to represent in your diagram.
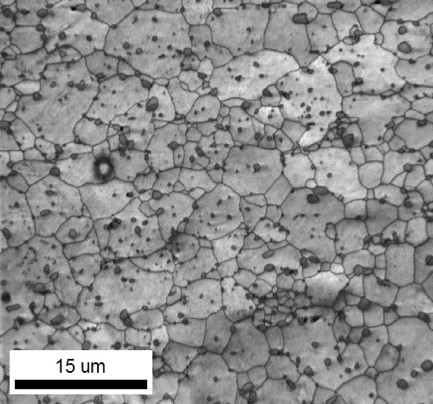
Figure 3: Image of the microstructure of AISI420 steel with carbide precipitates (Picture taken by Javier Hidalgo)
Hence, for representing microstructures with carbides we use a more sophisticated Voronoi diagram called the Multi-level Voronoi diagram.
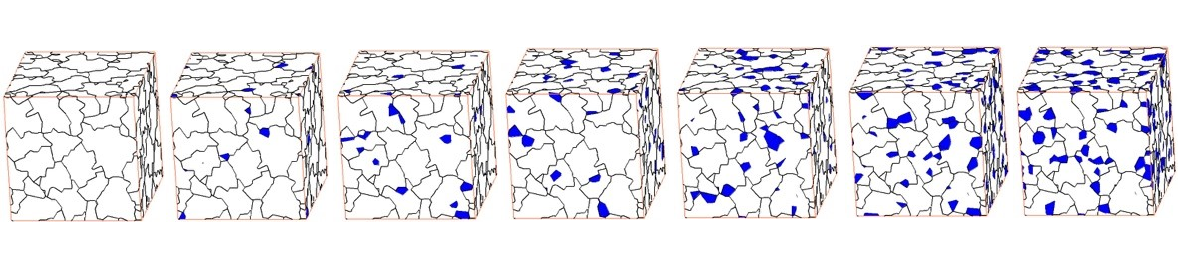
In this model, we generate more than one Voronoi diagram and we stack them according to a specific rule, which doesn’t need to be discussed in detail at the moment. In this way, we can have cells with different size distributions. In Figure 4, you can see that the white big cells represent the grains of pure iron and the blue small dots represent the carbides.
Figure 4: 3D Multi-Level Poisson-Voronoi diagram with two phases used to represent the microstructure of AISI420 stainless steel with M23C6 carbides, from left to right.
The advantages of using mathematical modeling are numerous. First, we have full control over the geometry, the orientation, the position, the size of the grains in the structure. Second, using this technique we can model the actual 3D structure and have 3D data. Finally, we do not have problems with measurement accuracy and we can generate as much data as we like.
Now that we have collected information about the microstructure, we need data on the mechanical properties. Therefore, we use our digital twin microstructures to perform a virtual tensile test.
Virtual Tensile Test
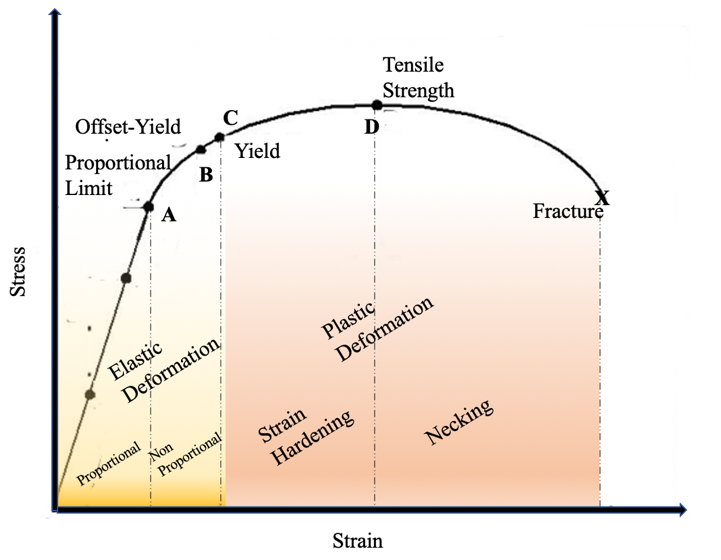
One of the most common ways to investigate the strength/ductility of metallic materials is tensile testing. The behavior of the material during a uniaxial tensile test is described in the so-called stress—strain diagram (Figure 5).
At the beginning of the test, force, stress, and deformation, strain, are proportional and the material shows an elastic behaviour, meaning that though we stress it, once we stop, it comes back to its original shape. Beyond the proportionality limit (Point A Fig. 5), the material is still elastic but it elongates at a higher rate under increasing applied stress. The end of the elastic region of the stress–strain diagram is the yield point (Point C Fig. 5).
Figure 5: Stress--Strain diagram
This point indicates a very important property of the material, the capability of the material to resist to stress before deforming in a non-reversible way. After the yield point the plastic region begins, where part of the material deformation is not recovered. In the first part of the plastic region, a very interesting phenomenon happens, the material becomes harder due to plastic deformation. The maximum point in the plastic region is called tensile strength or ultimate strength (Point D Fig. 5). After this point, the material starts to neck until it eventually breaks.
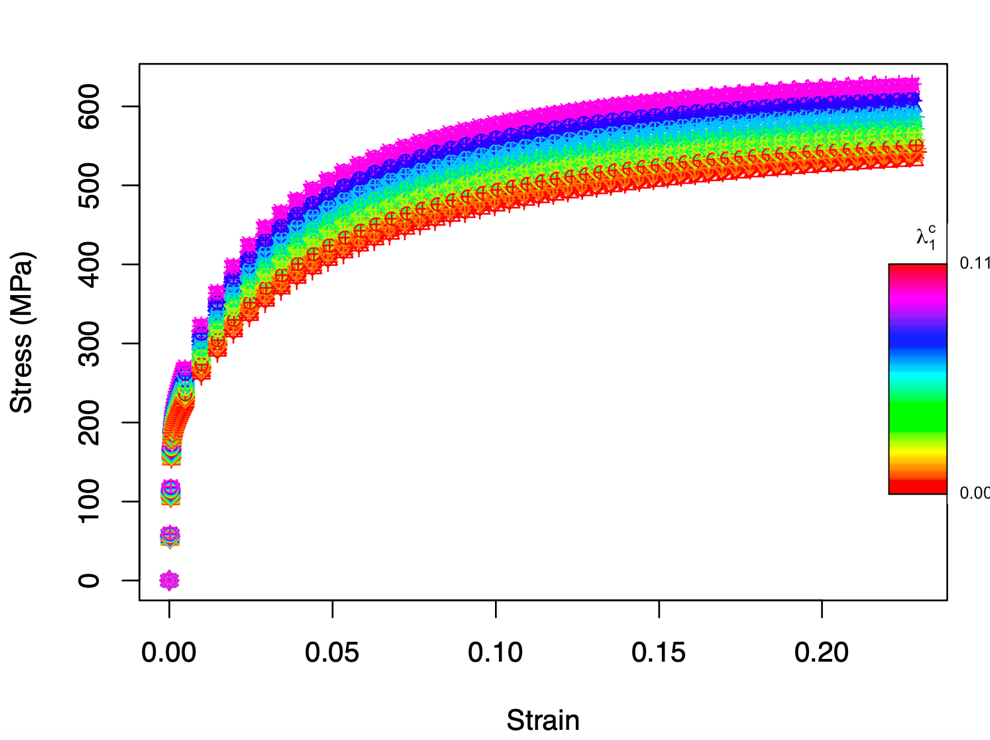
In physical experiments, every time a tensile test is performed, a sample is destroyed. Moreover, given that it is impossible to control one single microstructural factor at a time, it is hard to understand what generates the difference in the mechanical response of the material. In virtual experiments, we can use advanced technology and simulations to reproduce this test. For this specific experiment, we used the Düsseldorf Advanced Material Simulation Kit (DAMASK), a software developed at the Max-Planck-Institut für Eisenforschung, for conducting advanced microstructure–property simulation. We run the test and we obtain a stress-strain curve for each digital microstructure with a different carbide volume fraction, indicated by a color gradient in Figure 6.
Figure 6: Stress-Strain curves corresponding to the virtual microstructures with an increasing carbide volume fraction () obtained using DAMASK.
Interpretation of the results
Coming back to Tata Steel’s question: can we create steels with a specific yield strength?
We now have a model that tells us how carbides precipitates influence the mechanical behaviour of the material during a tensile test. Using our model we can predict the yield strength of the metals with a specific volume fraction of carbide precipitates, this is shown in Figure 6. A material with high yield strength means that for a given strain-value in Figure 6 the stress-value must be higher, as said before the different colors correspond to increasing, from red to purple, concentration of carbides. Therefore, Tata Steel can implement processes that favor the development of carbide precipitates for obtaining steel with specific yield strength.
However, we do need to perform real laboratory experiments both to initialize the parameters of our model and to validate the final results. Using virtual statistical experiments we can, nonetheless, reduce drastically the time and costs of physical experiments and increment the accuracy and the control of the microstructure features. In the design of superior materials, still, lots of challenges arise but simulations and modeling can help find solutions to many of these challenges.
*This research was carried out under projects number S41.5.14547b and T17019s in the framework of the Partnership Program of the Materials innovation institute M2i and the Technology Foundation TTW, which is part of the Netherlands Organization for Scientific Research. This article is based on Martina’s PhD thesis entitled “Statistical analysis of the relation between metallic microstructures and mechanical properties”.
The scientific world would not be what it is today without normal distribution. It is the foundation of many statistical models for several good reasons. Most importantly, it appears commonly in nature. But this is only the tip of the iceberg.
During our teenage years, everything changes. It’s no surprise that our brain does too. But how do we make sense of this transformation? Is there a way to quantify it? Networks might just be the answer.
We want our guts to be filled with a diverse range of mutually beneficial and competitive interactions, a perfect blend of friends, frenemies, and enemies to keep our guts active and body on its toes. Read how networks can help understand these interactions!
Think of a local car dealer selling cars in your region. To make sure new cars are delivered on time a whole mechanism involving various people, factories, and transport companies, must operate in coordination. This is a highly complex process where mathematics plays an important role.
Rafael Prieto-Curiel is a mathematician and a faculty member at the Complexity Science Hub in Vienna, Austria. His research focuses on crime, mobility, migration and urban dynamics. We interviewed Rafael to learn about his story.

 ) obtained using DAMASK.