You have a job interview in 20 minutes and you are in a hurry to arrive at your application in time. To make matters even more stressful, there are many routes to your destination, but you have no idea which one to select. Luckily, you have access to a navigation system that can help you in your route selection process.
After inserting your desired destination, your device prompts you to choose a route selection criterium. Surely, you tell your navigation system to select the fastest route. After all, it is the fastest route that is most likely to get you to your destination in time, right?
This may not always be the case. The travel time of your trip depends on many uncertain factors. For example, on your way to your job interview, you may get stuck in a traffic jam because of an accident, which will drastically increase your travel time. One could also think of smaller hindrances, such as having to wait for a bridge that is opening or repeatedly having to stop for red lights. Some routes will be more likely to cause delays than others. These routes bear a higher risk related to the travel time.
Since travel times are not fixed upon departure, it is important to realise that the fastest route suggested by your navigation system is only the fastest route in expectation. It may be the case that this route consists of roads that are likely to cause delays. As a result, the actual travel time corresponding to this route could be very uncertain. It is because of this uncertainty that the fastest route may not always be the most desirable route. Fortunately, there is a way to determine your most desirable route mathematically.
This is where probability distributions come in. A probability distribution is a mathematical function that describes the likelihood of the actual outcomes of an uncertain event. Specifically, in case of travel times, a probability distribution describes the probabilities of the actual travel times corresponding to a route.
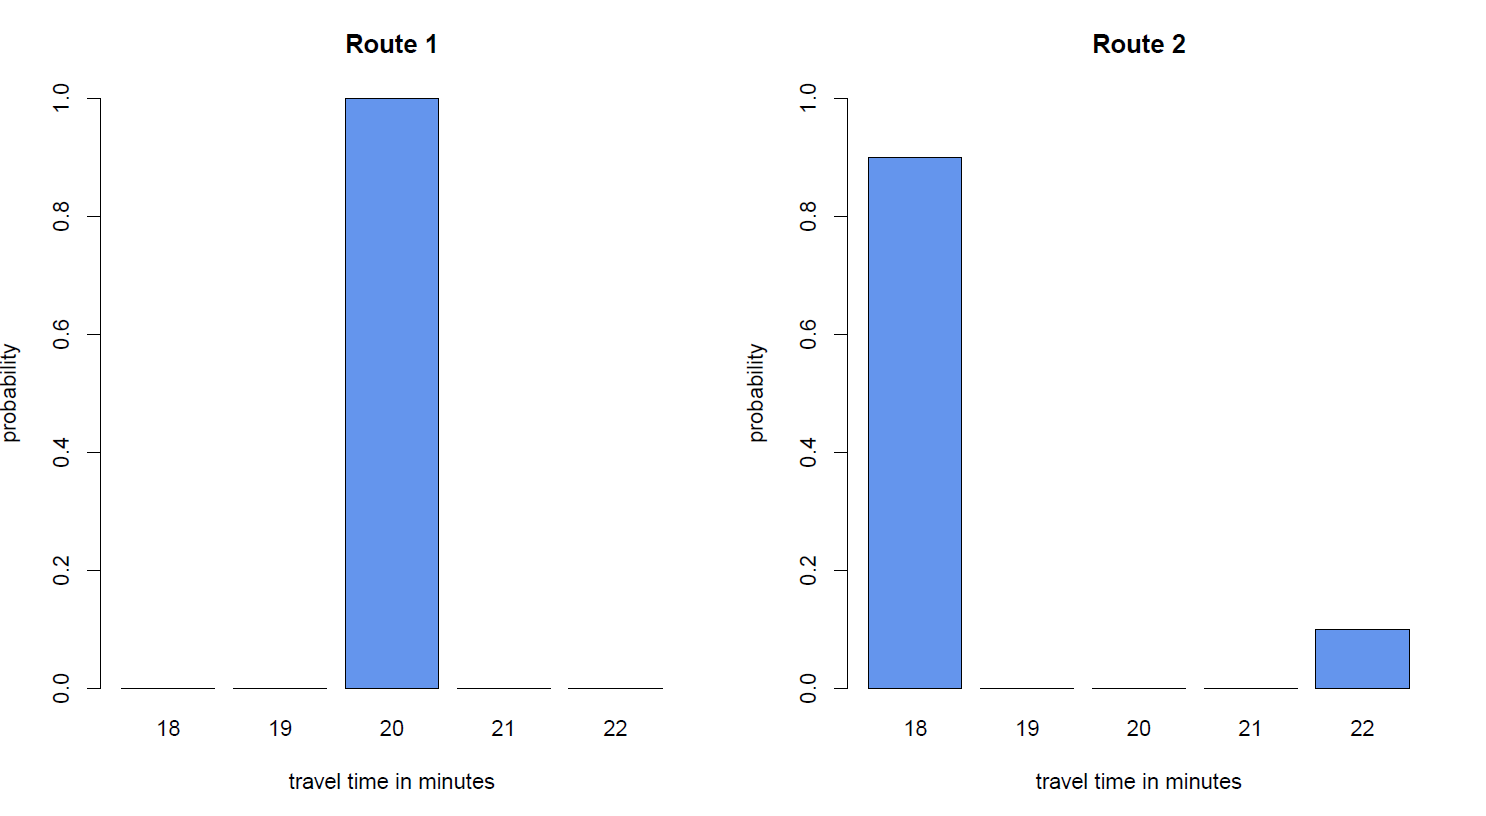
As a simple example, suppose there are only two possible routes to your job interview. Route 1 takes with certainty 20 minutes to traverse, whereas Route 2 has a shorter travel time of only 18 minutes. However, on Route 2, there is a 10% chance that you have to wait for an open bridge, causing a 4 minute delay. The probability distributions of these routes are shown in Figure 1.
Figure 1: The probability distributions of two routes to your job interview. Route 1 has a travel time of 20 minutes, whereas the travel time of Route 2 is either 18 minutes (with a probability of 90%) or 22 minutes (with a probability of 10%).
Of course, the probability distributions in Figure 1 do not give an accurate representation of the real world. It seems unrealistic to assume that a travel time can only equal a few distinct values. In fact, the number of possible travel times may be so many such that every travel time has a probability of 0% of occurring. As a consequence, the probability distribution will not contain any useful information.
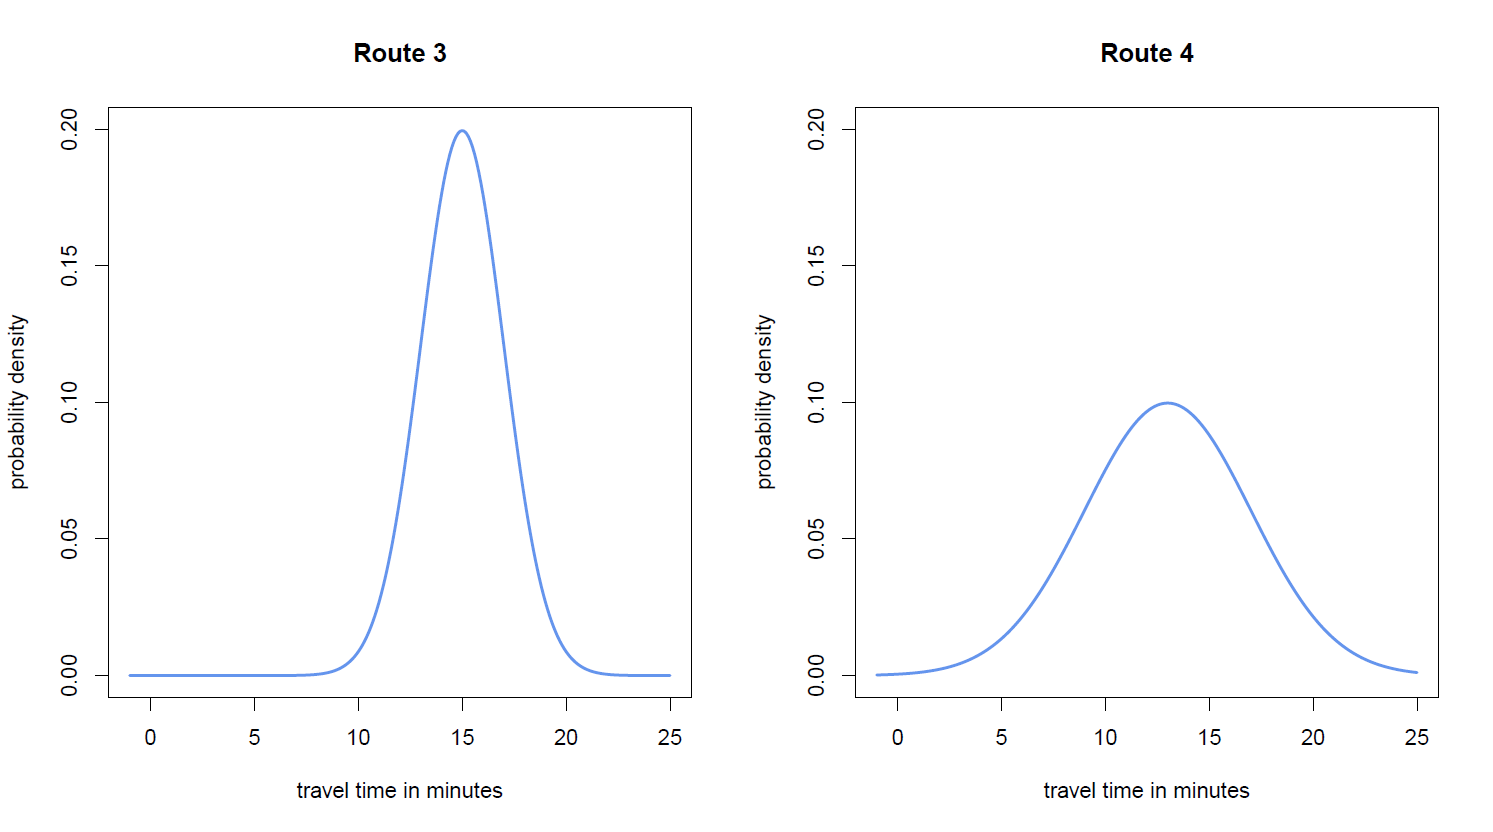
This gives rise to probability density functions. These functions describe the relative likelihood of the actual travel times, while the absolute likelihood for a particular travel time is 0. Two examples of probability densities can be found in Figure 2.
Figure 2. has a normal distribution with mean 15 and variance 4 (left) and has a normal distribution with mean 12 and variance 16 (right).
Relative versus absolute likelihoods As said before, the absolute likelihood for a particular travel time is 0. For example, your travel time will never be exactly equal to 17 minutes. But, the probability that your travel time is between 17 minutes and 17 minutes and 1 second is quantifiable and non-zero. This probability can be estimated using the value of the probability density function at the point 17 minutes. For the probability density on the left this probability is equal to while for the probability density on the right this probability is equal to . The probability density can be interpreted as the relative likelihood that the travel time is close to 17 minutes.
Probability density functions can also say how much more likely some outcome is compared to another outcome. For example, in the probability density on the left, the value around 15 minutes is 0.20 and the value around 20 minutes is approximately 0.01. Hence in this probability density it is more likely to have a travel time close to 15 minutes than a travel time close to 20 minutes.
Choosing the best route
Routes that are expected to have a short travel time will have a probability density that is centred around a relatively low value. Unreliable routes, i.e. routes on which there is high uncertainty about the travel time, will have a probability density that is more spread.
As an example, suppose you get to choose between two more routes for which the travel times have probability densities as in Figure 2, where the travel times of Route 3 and Route 4 are denoted by and . Since the probability density of is centred around a lower value, Route 4 has a lower expected travel time compared to Route 3. Consequently, if you ask your navigation system for the fastest route, it will recommend Route 4.
Having access to the probability densities means that it is possible to explicitly compute the probabilities of in time arrival. This is done by integrating the probability densities over the travel times that lead to in time arrival. If and denote the probability densities of and , then the probability that you arrive within 20 minutes at your job interview is given by
It is remarkable that Route 4 has a lower mean travel time compared to Route 3, but at the same time this route is more likely to take more than 20 minutes to traverse. You may want to verify yourself that we find the same phenomenon for Route 1 and Route 2 in Figure 1.
It turns out that if you want to maximise the probability of arriving at your job interview within 20 minutes, the expected fastest route, which is the route that will be suggested by a navigation system, is not your best option!
The featured image of this article is due to waldryano and is taken from Pixabay.
Nowadays we have route planners such as TomTom and Google Maps to make driving to a holiday destination a lot simpler. In this article we explain the science behind these route planners.
Say you are living in Eindhoven and would like to spend a day in Amsterdam: what better way to get there than taking the train? Before your train departs, a whole logistic operation has taken place in the headquarters of the railway company to make this trip possible.
Road traffic analysis is one of the topics that receives a lot of focus in the NETWORKS program. Are you courious to read what kind of questions about road traffic mathematicians try to answer? Have a look at this update.
 has a normal distribution with mean 15 and variance 4 (left) and
  has a normal distribution with mean 12 and variance 16 (right).
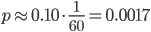 while for the probability density on the right this probability is equal to
 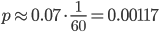 . The probability density can be interpreted as the relative likelihood that the travel time is close to 17 minutes.
 more likely to have a travel time close to 15 minutes than a travel time close to 20 minutes.
  and
and  denote the probability densities of