In two previous articles (part 1 and part 2), we have discussed the design of manufacturing plants. In particular, in this article, we have concluded that queueing networks are the tool to successfully design these plants. Then, we have seen in this article that queueing networks actually consist of multiple layers, or layered queueing networks, in which the parts in the network can play several roles. How can we use mathematics to analyse these queueing networks, to help us to create the best possible design for the manufacturing plant?
The difficulty of layers
Earlier, we have seen that layered queueing networks are found in manufacturing plants, as well as many other applications in society. The math behind such networks is much more challenging than traditional queueing networks, amongst others because the input and outputs of the different layers rather heavily depend on one another.
For example, in manufacturing plants, we typically know pretty well how long a product spends waiting in the queue or buffer a machine before being processed. The sum of these waiting and processing times is an important measure describing the efficiency of a machine, and is also called the sojourn time of a product.
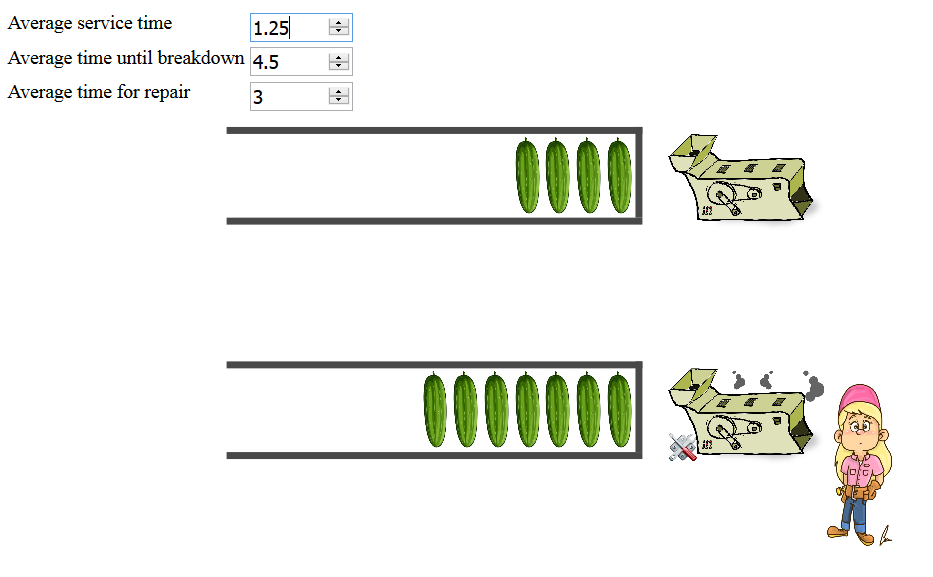
Indeed, when a machine works twice as fast (or, alternatively, the service time gets halved), the sojourn time approximately gets halved as well. But what happens if instead the mechanic would repair the machines twice as fast? The repair speed of the mechanic obviously is highly relevant! When the repairs take very long, machines are offline all the time. Then products wait for a long time as well, their sojourn time go sky high, etc. See for yourself below!
But, how exactly are the sojourn times of products influenced by the mechanic repairing slower or faster? Even the applet above does not give a satisfactory answer to this obviously crucial question! In the terms of the layered network, we often know how the performance of the first-layer servers impacts the sojourn times of the first-layer customers, but not exactly how the performance of the second-layer servers influences the performance. We cannot quite identify how the layers affect one another, let alone quantify it!
As if this were not enough, there is something else that makes mathematical analysis of layered queues notoriously hard. Imagine the (unrealistic) scenario that the machines would never fail, and thus no mechanic is ever needed. Then, the sojourn times of products before one machine do not influence those in front of another machine. After all, the machines are working `autonomously' and independently of one another...
This changes completely when machines fail, as is the case in a manufacturing plant, as machines need to wait longer to be repaired when there are many broken machines. The mechanic can only repair a single failing machine, as she/he cannot be in two places at the same time. Therefore, failing machines will have to wait for others to be repaired first. This makes that downtimes quickly add up when more machines are broken.
This effect is even stronger since the layers influence one another as well! Again, the exact nature of this influence is extremely hard to quantify in general.
So, how do we go about analysing layered queueing networks?
Limiting regimes: light and heavy traffic
Obviously, manufacturing plants need to be well designed. It certainly helps when we mathematically understand layered queueing networks, but this is quite difficult as we explained before. We would like to be able to predict things like waiting times and sojourn times, given a certain amount of buffer space and a number of machines. And this is precisely what it means to `mathematically understand layered queueing networks'. How can we achieve this daunting task?
When confronted with a difficult mathematical problem, it often helps to see whether there is a simpler problem that one can understand. This is a standard approach in math, when a problem is too hard, then simplify it! Of course, the simpler problem should help us to understand the harder problem, so that we increase our insight.
One simplification consists of so-called `limiting regimes'. For example, when the machines hardly ever need to process products (this is called the light-traffic regime for obvious reasons), we can calculate the average sojourn times of products, or the average number of products in the first layer buffers (queue lengths). This does not sound too surprising.
More surprisingly, we can also perform such an analysis in the exact opposite case, when the stream of incoming products to be processed is so dense that the machines can only just manage it (the heavy-traffic regime). From a practical perspective, obviously the latter is more relevant, as in the light-traffic regime we have simply bought too many machines.
The actual intensity of the incoming stream of products in real factories is somewhere in the middle of these two regimes, so that we know that we know that the actual sojourn times and queue lengths are somewhere in the middle as well. This so-called `interpolation method' turns out to yield highly accurate predictions (Dorsman et al., 2013).
Such predictions help us to design manufacturing plants, since these approximations do take the layers into account. Interestingly, it also helps us to gain insight in many other questions that engineers in factories are are faced with. For example, we can decide which machine should be repaired first if several machines are down, which depends heavily on the number of products waiting in the first layer. Making effective use of this answer tremendously speeds up the time it takes to convert raw material into a final product (Dorsman et al., 2015):
The power of math at work!
We have learned a lot about the design of manufacturing plants, and how to analyse them using layered queueing networks, and this provides a great example of how math can be used in the real world. There is a lot, though, that we do not yet know, while their real-life applications become more prominent. This provides quite a challenge for network scientists and mathematicians alike! Keep an eye out on this website, we will keep you informed...
Scientific references
J.L. Dorsman, R.D. van der Mei and M. Vlasiou (2013). Analysis of a two-layered network by means of the power-series algorithm. Performance Evaluation, 70(12), 1072--1089.
J.L. Dorsman, S. Bhulai and M. Vlasiou (2015). Dynamic server assignment in an extended machine-repair model. IIE Transactions, 47(4), 392--413.
We want our guts to be filled with a diverse range of mutually beneficial and competitive interactions, a perfect blend of friends, frenemies, and enemies to keep our guts active and body on its toes. Read how networks can help understand these interactions!
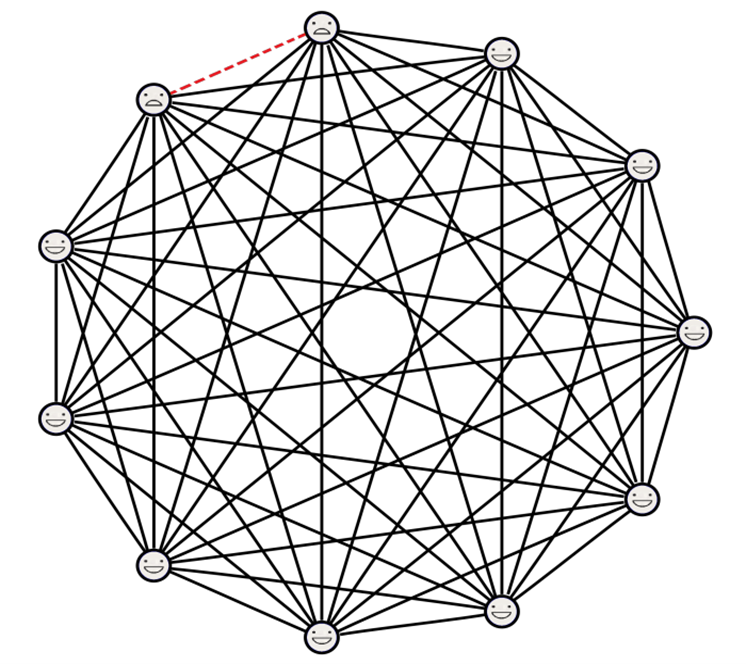
Have you ever found yourself less popular when compared to your friends? Interestingly, in any group of individuals, on average, people have fewer friends than their friends do, or at the very most, an equal number. Not more!
One of the main building blocks of modern AI-tools are artificial neural networks, abstract models inspired by the structure and functions of biological neural networks which enable machines to "learn". In this article, I will discuss some thoughts on this topic.
This article discusses a fun puzzle that illustrates a beautiful open problem in this area: queueing theorists are trying to figure out how the structure of a network impacts its ability to distribute work among the nodes.