How are elements in real-world networks connected? That is the question we aim to answer in this post. Most real-world networks turn out to be extremely inhomogeneous. In particular, many real-world networks, ranging from Internet to the World-Wide Web to networks of interactions between proteins in biology, show large differences in numbers of connections between the different elements in the network under consideration. What does this mean in practice, and what does it mean for you?
Recall that the number of connections of an element in a network is called its degree, and that the collection of the degrees of all the elements in the network is called the degree sequence. What can we say about degree sequences of real-world networks? In social networks, do people typically have (roughly) equally many friends, or is there an enormous variability in numbers of friendships? And how is this in other real-world networks, ranging from Internet to the World-Wide Web to networks of interactions between proteins in biology? How similar are degree sequences arising from different networks?
Well, it turns out that degrees in networks are highly variable. This means that in most networks, there are elements that have a huge amount of direct connections to others, and these individuals tend to be rather important. They are called super-spreaders in the context of the spread of diseases, or hubs in the context of networks of airports. The fact that they have been given various names already indicates that they are important. See this article for the role of such superspreaders in the spread of information and possibly diseases in real-world networks. Parts of the present article are adaptations of that article. Here we focus on the degree statistics in real-world networks.
As explained before, the degrees in a network (in a populations) can be summarized by a function that describes the proportion of elements (for example, people) that have a certain degree. We assume that we have all the details of the network available, so that we know exactly how many friends every individual has. Then, we write down the percentage of people who have degree zero, one, two, , a hundred, a hundred and one, , two hundred, , and so on, for each possible value for the degree. This gives us a function, which we call the degree distribution, and is just another way of representing the counts of the number of elements with given degrees. The advantage is that it is a little more robust in the size of the network than explicit counts that tend to grow with the network size.
Already 20 years ago, scientists figured out the importance of the degree distribution, and have investigated it in various network representations of the human population. And they didn't stop just there: besides analysing the degree distribution of human populations, they also studied the degree distribution of many other networks, such as the Internet router network, the World Wide Web, Twitter networks, the Facebook network, brain activity networks, gene networks, food-chain networks (which animal eats which other animal or plant), airport networks, electricity networks, and many many more.
Here is the bottom line. What they found is absolutely intriguing. They found that, surprisingly, many networks in real life have basically the same degree distribution function!
Indeed, if you take the proportion of elements in the network that have degree equal to , and plot this as a function, you get a dot for each degree. If you try to fit a continuous function to the dots, then you will notice that a function like fits the best in many cases. Sometimes you would find the best fit to be , or and so on, with different numbers in the exponent of , but it is always a function that is ``one over to the something''. Sometimes, an exponential function like fits better. But never a logarithm, or a sine, or any other function that you may have learned about.
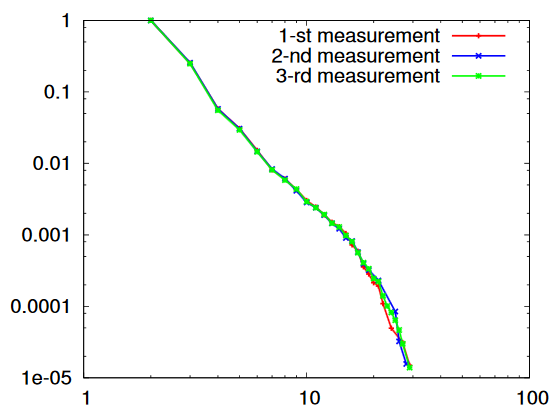
This particular degree distribution, that is , has popped up in so many cases that it has been given a name. We call it the power-law function. The ``something'' here is very important. It too has a name: it is called the power-law exponent. Power-law degree distributions are observed in the Internet,
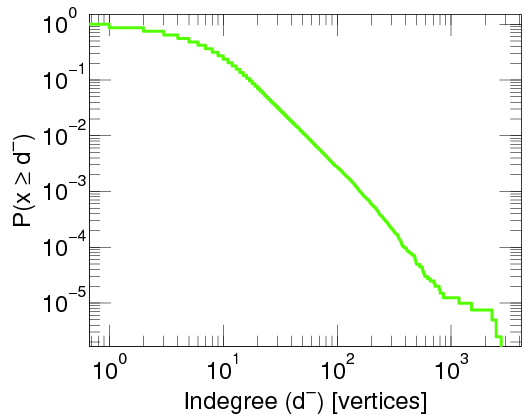
A log-plot of the proportion of degree of routers in the internet. Taken from here by Latapy, et al (2015).
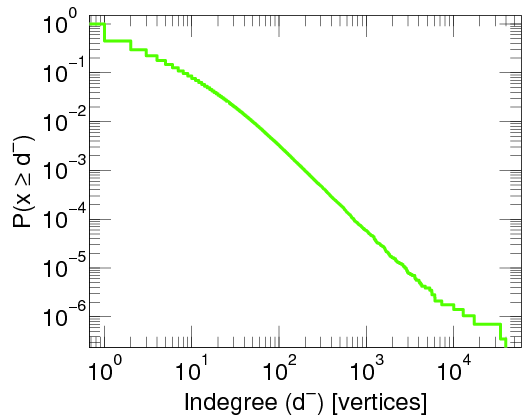
in the WWW (between webpages linking to each other), on Twitter
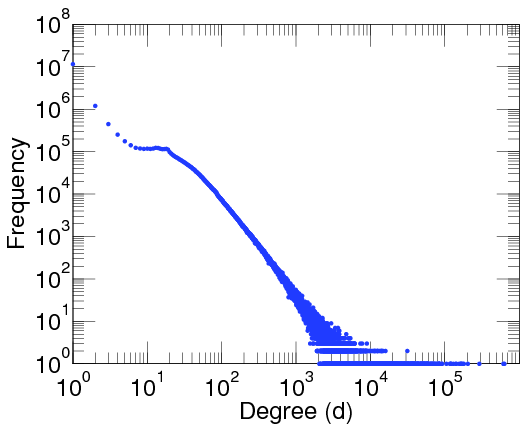
A log-log-plot of the proportion of twitter users that have been cited by other twitter users at least a given number of times. Taken from here.
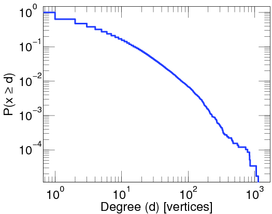
in ecological networks (where, for instance, vertices are plant species and animals, and a connections is made when the animal eats the plant), in neural networks (the neurons in your brain also form a huge network!), friendship networks
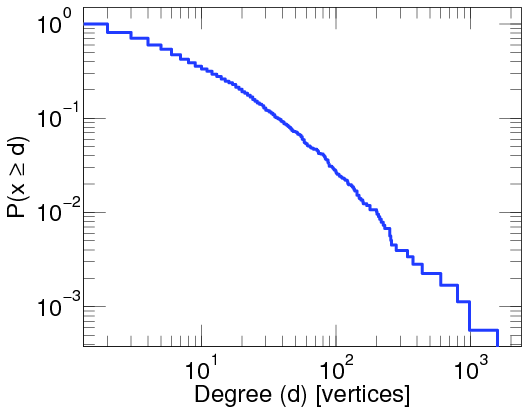
A log-log-plot of the proportion of people with at least a given number of contact in the brightbite social network.
and in many other cases. This is quite fascinating, and prompts the question why this is the case. However, let us first explain how the above pictures relate to power laws.
In the pictures, and with a little bit of imagination, you see a straight decreasing line. Note, however, that the plots are a little unusual. They are called log-log plots. In a log-log plot, the scales of both axes are logarithmic. Seeing a straight line on a log-log plot is the ultimate evidence that the function is a power-law. If you want you can open a more detailed (and thus technical) explanation of this fact below.
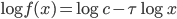
Let be the proportion of elements that have degree , where Suppose that for some power-law exponent and . Then, we note that if we take the logarithm (which corresponds to the exponent of 10 on the axis), then we obtain that
,
so that is a linear function of (the latter corresponds to the exponent of 10 on the -axis). Further, the slope of this linear function is , so that we can get an idea what is by looking at the slope in a log-log plot.
Even stronger, the slope of the line corresponds to the power-law exponent. The degree distribution of many networks are plotted here Degree distributions@Konect-Uni-Koblenz. By clicking on the link under a distribution plot, the network is explained in more detail.
The fact that power-law degrees are so abundant in networks is very intriguing and many scientist have given a hard thought on explaining the reasons for it. Nowadays, we think we know why this happens, but the explanation is far from easy, so let's save that story for another time!
Further, mathematical research has exemplified the importance of the precise value of the power-law exponent. Many of the above mentioned networks turn out to have an estimated exponent between two and three: for the Twitter network it is 2.86, for the core internet it is 2.1, for the social network Brightkite it is 2.48.
products bought by the same persons on Amazon
Links between Wikipedia articles
Nouns used in the bible, nouns are connected if they are used in the same verse.
In all these networks, the largest degree is really substantial: several orders of magnitude larger than the average degree. The largest degrees range from several tens of thousands to several hundred thousands, which really is quite a lot. Can you imagine having a hundred thousand friends on FaceBook or Instagram? That would be quite something!
Also, there are strong indications that the network elements with highest degrees play a special role. A Tweet by Trump is certainly read by way more people than one that we might write! Telling your gossip to a highly-connected person certainly makes it spread all the more quickly, wouldn't you agree? And this is the lesson for you: if you want your news to spread fast, ask someone with many followers to retweet it. Then you are bound to reach way more people than if you don't! However, it also means that people with many friends are more likely to be infected by an infectious disease (or to have a virus on their computer), as they are in contact to more others that could spread the infection to them.
So, what have we learned in this article? Well, that degrees in many real-world networks vary a lot, and that this can be quantified by a mathematical law called a power law. This power law has a crucial parameter in it that is called the power-law exponent that measures roughly how large the largest degree is when the network grows large. This power law and its corresponding exponent can be visually inspected using a log-log plot. Finally, we have seen that the elements in the network that have the highest degree often play a special role in the network.
We want our guts to be filled with a diverse range of mutually beneficial and competitive interactions, a perfect blend of friends, frenemies, and enemies to keep our guts active and body on its toes. Read how networks can help understand these interactions!
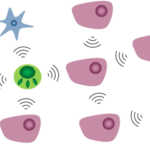
It is quite difficult to extract information from your body. Your body is so vast that millions upon millions of messages get sent and deleted every second. It is impossible to know exactly who said something. The doctor’s main challenge is finding a way to reconstruct the network of interacting cells given the limited information she can measure.
During our teenage years, everything changes. It’s no surprise that our brain does too. But how do we make sense of this transformation? Is there a way to quantify it? Networks might just be the answer.
If, after reading the title, your immediate response is to shout "1/6-th", then you have correctly answered the question. Well done! However, in this article we will focus on the meaning of this question. What exactly is this "chance" of which you've just exclaimed it equals 1/6-th?

 , a hundred, a hundred and one,
  , and plot this as a function, you get a dot for each degree. If you try to fit a continuous function to the dots, then you will notice that a function like
  fits the best in many cases. Sometimes you would find the best fit to be
  , or
, or  and so on, with different numbers in the exponent of
  , but it is always a function that is ``one over
  fits better. But never a logarithm, or a sine, or any other function that you may have learned about.
 , has popped up in so many cases that it has been given a name. We call it the power-law function. The ``something'' here is very important. It too has a name: it is called the power-law exponent. Power-law degree distributions are observed in the Internet,