In mid-March this year, my colleagues and I participated in a three-day science fair in Brussels, called Science is Wonderful!.We designed an interactive booth aimed at introducing young people aged 8-18 to network science. To showcase different concepts within the field, we created four hands-on activities, each exploring a different aspect of networks. Since the fair allowed visitors to move freely between exhibits, several members of our team were often running different activities simultaneously, sometimes in three different languages!Below, we collected our activities, as well as some take-aways for others that want to run a mathematics booth at a science fair.
Our team, from left to right: Elaine Herrera, Réka Szabó, Serte Donderwinkel, Nicolas Tokka
Try it yourself!
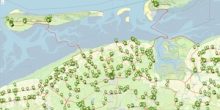
Euler tours. We prepared whiteboards with maps drawn on them. Each version included the same core elements: a river, a house on one side, a forest on the other side, several islands, and a collection of bridges connecting them.
Our challenge: Starting at the house, can you take a walk that crosses every bridge exactly once? Is it possible? And where do you end up?
We designed the maps so that every puzzle had a solution, so it was always possible to plan a walk that crosses each bridge exactly once. However, some walks ended back at the house, while others finished in the forest. Once the children found a valid route, we challenged them further: could they end on the other side instead? If their walk originally ended at home, could they make one that ended back at the forest?
After some experimentation, and quite a bit of frustration, they discovered that it was impossible! The final step was to search for a pattern. What determines where you end up?
It turns out that it does not depend on the total number of bridges, but on the number of bridges that are connected to each location. If every location has an even number of bridges, you always return to your starting point. But if exactly two places have an odd number, the house and the forest in our maps, then a walk that crosses each bridge once will start at one and end at the other.
Where’s the math? This puzzle is based on the famous Seven bridges of Königsberg problem, which led to one of the earliest theorems in graph theory: the conditions required for an Eulerian trail. In other words, what needs to happen so it is possible to plan a walk that crosses each bridge exactly once.
The map can be translated to a graph, where the house, forest and islands become vertices and the bridges become edges connecting them. Euler’s key insight was quite simple: every time you enter a location by crossing a bridge, you must also leave it by crossing another one. This means that bridges must be used in pairs at each location!
As a result, most locations must have an even number of bridges connecting them. The only exceptions are the start and end points. If the walk starts and ends in different places, those two locations will have an odd number of bridges. If every location has an even number of bridges, the walk must end where it began.
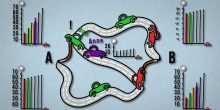
Travelling salesman problem. This activity was a last-minute addition to our booth, but one that quickly became popular!
Imagine you are a delivery driver with several packages to drop off. Starting from a distribution centre, you need to visit every destination exactly once before returning. What is the shortest possible route?
In the example above, there are only a few stops, so it is possible to brute force the problem by calculating the length of every possible route. There are only 24 possible routes in total: 4 ways to pick the first stop, 3 ways to pick the second, 2 for the third, and the last stop is then fixed. So the number of possibilities is . However, this becomes drastically harder as we add more stops!
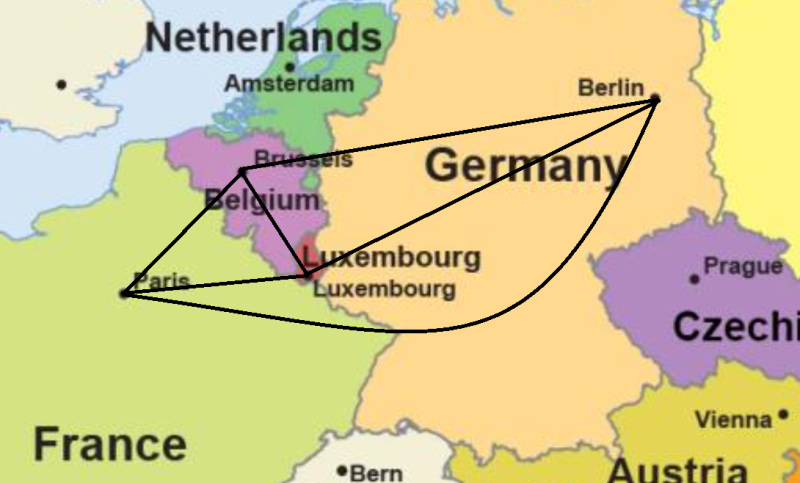
A map of the Benelux (Belgium, Netherlands, Luxembourg) and various stops, represented by nails/pins.
Now consider a delivery with 19 stops made throughout the Benelux countries, starting and ending in Groningen. How many possible routes are there?
The answer is:
That is over 121 quadrillion possible routes! To put that into perspective, even if a computer could check 100 000 routes every second, it would still take roughly 38 500 years to test them all.
Our challenge: We placed nails at each labelled city on the map and tied a long piece of string to Groningen. The students had to stretch the string so that it visited every city before returning to Groningen. If they completed the route with string left over, they were allowed to cut the remaining piece and claim the current “best record”. We even took Polaroid-style record-holder photos for them to keep!
Many students returned multiple times throughout the day to see whether anyone had beaten their record, and some even brought friends back to challenge the current champion.
Where’s the math? The travelling salesman problem is one of the most famous problems in computer science and mathematics. While small examples can be solved by checking every possible route, the number of possibilities grows explosively as more cities are added.
This connects to one of the seven Millennium Prize Problems posed by the Clay Mathematics Institute: the P versus NPproblem. It is easy to check whether a proposed route is correct and how long it is, but it is not known whether there is a fast algorithm that can always find the best route quickly for every possible case.
Wikipedia crawl. We reserved this activity for some of the older students, with the goal of exploring large networks and their surprising properties!
Our challenge: Start on the Wikipedia page for Marie Curie, and try to reach the page for banana. You can navigate only by clicking links within Wikipedia pages, and the goal was to get there in as few clicks as possible. Again, the students could earn a record holder picture and have their name up on the record board.
What surprised many students was that they typically needed only 4-7 clicks, even though Wikipedia contains millions of pages! To understand why this happens, we introduced a second challenge: start at two completely unrelated Wikipedia pages and try to reach the same page using only internal links. This became a collaborative puzzle, where students worked together to develop a strategy to efficiently navigate enormous networks. To motivate a successful strategy, we compared Wikipedia to a social network.
An example of a social network
Suppose you wanted to find a connection to a random person in New Zealand. One possible strategy would be to contact the most well-connected person you know, and ask them to contact the most well-connected person they know. If the person in New Zealand does the same, there is a good chance that these highly-connected people, or hubs, are linked through only a few intermediaries! We obtain a simple strategy: First reach a hub, because hubs tend to be close to one another.
Where’s the math? We can view Wikipedia as a network where pages are vertices and the hyperlinks are edges connecting them. Mathematicians studying large networks discovered something remarkable: in many real-world networks, a small number of vertices have an enormous number of connections. These highly connected hubs drastically shrink the distances between other nodes. In fact, in some network models, the typical distance between two vertices grows roughly like , where is the size of the network. This phenomenon is known as the ultra-small world property.
In practice, this means that even gigantic networks can still feel surprisingly “small”. This helps explain why information (and viruses) can spread so quickly, why social networks connect strangers through only a few acquaintances, and why you can reach almost any Wikipedia page in just a handful of clicks!
What we learned
What worked well? One of the most effective aspects of the booth was getting students into a hands-on activity quickly, with only a brief introduction beforehand. Rather than being told about concepts, they could immediately try something for themselves. Ideally, we gave them an easier-to-solve puzzle to start with, like a small Euler map or a Wikipedia crawl to a well-connected page, to spark motivation for a more stout challenge later.
We found that productive struggle worked well: activities that were slightly challenging and occasionally frustrating tended to be more engaging than those that were immediately obvious or too simple. Students were more invested when they had to experiment, revise their approach, and try again.
The competitive element was another strong motivator. Having a “record to beat” naturally encouraged repeated attempts and peer interaction. In a similar way, small rewards such as a photo keepsake for record holders added an extra layer of motivation and excitement.
Finally, we also used the activities as a starting point for a conversation about the nature of mathematics. Our field has a bad reputation for being about boring calculations, but we explained that math is mostly about solving puzzles, finding patterns and justifying them with logical reasoning. After experiencing the joy of that first-hand, we felt that this message landed with the kids.
What did not work well? The setting of a busy science fair favored activities that were quick to start and easy to reset. As a result, more time-intensive explorations were less suited to the environment. For example, we prepared an activity to discover Braess’ paradox, that shows that opening a new road may increase everyone’s travel time, based on the lesson plan developed by Clara Stegehuis. However, due to the long attention span needed to reveal the paradox, this was more suitable for a classroom setting than a dynamic science fair: the concepts required more time and reflection than the fair setting allowed for.
Moreover, the Euler puzzle requires near constant communication, so this is a harder activity with big groups and may get chaotic. In these situations, the Wikipedia crawl and the travelling salesman puzzle are easier to run because the kids entertain themselves for a while.
Across the activities, it was exciting to see how naturally students engaged with ideas that are usually introduced only much later in mathematics courses. By turning abstract concepts into physical puzzles, collaborative games, and sometimes competition, network science became something they could explore intuitively before learning the formal theory behind it!
Social networks are remarkably small, in the sense that you can hop between any two individuals in them using only a few hops. This video explains what such small-world networks are, why social networks are so small.


 . However, this becomes drastically harder as we add more stops!


 , where
  is the size of the network. This phenomenon is known as the ultra-small world property.