“159, 160, 177, 206 …”, we turn up the volume of the television to be heard above the noise of the rain tapping against the window. The female narrator of the Dutch news enumerates the registered number of drugs dumping in the Netherlands. The criminals running Illegal drugs labs in (the South of) the country often dump their toxic remainders in public places. While the records of 2014-2017 are still displayed on the screen she concludes:
“The number of dumpings of drug waste is increasing.”
My girlfriend asks me what is wrong when she notices I lift one eyebrow in response to this conclusion. I answer:
“She ruled out the possibility that these numbers are just increasing by chance.”
Laughing at my answer she turns her head back to the screen and whispers “the statistician has to show off again”. Offended by her reaction, I leave the comfortable position I was in and sit up straight:
“Three increases in a row, how can you be so sure that this did not happen by chance?”
One look at her face was enough to regret the fact that I raised my voice.
Most of you will agree with my girlfriend that when the number of drugs dumping increases for three years in a row, this points to an increase in the demand for drugs, the number of illegal producers, the amount of drugs produced etc. In other words: you expect that the system underlying this data changed. However, after you sit with it for a while, you might notice that the records of 2014 (159), 2015 (160) and 2016 (177) seem to be quite comparable. Moreover, in a search for more data, I found that the Dutch police force elsewhere reports 176 dumpings in 2014 instead of 159 [1] (Figure 2.1,Ontwikkeling van dumpingen/lozingen van 2010-2015), thus there seems to be some discussion about the exact numbers!
With these new numbers the streak of strictly increasing years started in 2015 and is therefore only two years, only two years of increasing records. Now, some of you might start doubting whether there is really a trend going on. Did drug crime really increase, or were the numbers just coincidence? As a probabilist I would like to quantify the probability that we observe 3, respectively 2, increases in a row while in reality nothing changed. So what is the probability of a large number of increases in a row when each outcome is generated by the same system?
Until now we focused on the yearly number of drugs dumping. However, the raised question (coincidence or a structural change) is the same for many other yearly counts. Think for example about the average temperature, the total sales volume of a company or the number of births in the Netherlands. The questions for each of these outcomes are mathematically equivalent. Imagine we observe the records of such an arbitrary outcome for two subsequent years. Let us, as a devil’s advocate, assume that there is no trend in the average yearly temperature, there is no trend in the sales volume or there is no trend in the number of births in the Netherlands. The mechanism (underlying the two data points) remains the same and we say that the system is stationary. It is crucial to realize that this does not imply that the records of both years are equal. We are dealing with year-to-year variability of the outcome.
In the case of a stationary system, the probability that more children were born last year than the year before is 0.5 and the same is true for a temperature or sales increase. The counts in both years are a realization of exactly the same (possibly very complex) random experiment and thus there does not exist an order that is more likely. To describe this a bit more formal we start modelling the year to year change, which is either a decrease, an increase or an equality. For simplicity we assume that yearly counts will never be exactly the same. So now we are dealing with only two possible changes: an increased count (marked as a 1) or a decreased count (marked as a 0), which have the same probability of 0.5 to occur. The number of drugs dumping in 2017 equaled 206, which was higher than the number of drugs dumpings in 2016 (177), the outcome of the described random experiment is thus 1.
In a world where the number of drug labs, the demand of drugs, the production costs (and all possible other drivers of production) did not change from 2016 to 2017, the probability of this increased count was equal to 0.5 . By observing such an increase we do not have any reason to believe that drug crime increased, or in other words, we have no reason to conclude that the system is not stationary. Imagine the Dutch news of October 7th last year had only presented these two numbers followed by the claim “The number of dumpings of drug waste is increasing” you would not have been convinced by the probabilistic reasoning just presented. Clearly, the human intuition is capable of realizing that only one year of increased counts would be very common in a world where no fundamental changes took place. To confirm this consider the average temperature in the Netherlands (in De Bilt) in 2015 (10,90˚C) and in 2016 (10,70˚C)[2]. Solely based on this decrease, would you dare to say anything concerning climate change?
In the case of the drugs dumping (160 counts in 2015) we would like to quantify the probability of two subsequent increases, referred to as (1, 1), when in reality the system did not change at all. The other possible outcomes are: two subsequent decreases (0, 0), a decrease followed by an increase (0, 1) and the opposite thing (1,0). The three yearly counts are assumed to be generated by the same stationary system. Hence you might expect that all possible outcomes: (1,1), (0,0), (1,0) and (0,1) have the same probability of occurrence and equals .
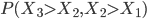
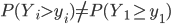
FALSE! The system generating the yearly records independently might be the same, this is not true for the first increase/decrease and the second change. When we focus only on the first two years, two things could have happened: the number of births in the Netherlands in the second year was larger than in the first year (1, ?), or the opposite is true (0, ?). In the (1, ?) case we now know that the number of births in year 2 is relatively large (at least larger than the number of babies born in year 1).
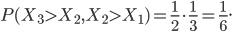
The probability that the number of babies born in year 3 is larger than the number of births in an arbitrary previous year is 0.5. However, when comparing to the year 2 count, we compare to a value which is less arbitrary since it is for sure larger than the first year’s count. Consequently, the probability of a second increase (given the first increase), is less than 0.5 and thus is the probability of a (1,1) event less than 0.25!
The same reasoning can be used to conclude that the probability of three increases in a row is larger than . Without going into the details of the mathematical derivations, the (1,1)-probability equals approximately 0.17. This is as likely as throwing a specific number with a fair dice and is therefore not enough proof to conclude that the system is not stationary.
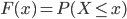
Suppose that the count of drug waste dumped in year , denoted by , follows a continuous probability distribution with cumulative distribution function (cdf) . The probability of two increases in a row is then equal to and equals , because is increasing. Let , then follows a Uniform distribution irrespective of the distribution of , we can see this as follows
where denotes the inverse of the cdf. Using twice the definition of conditional probability, the probability can be rewritten as
By computing the integral we find that
In the case of a discrete distribution for , which will be the case for countable random variables, the probability cannot be derived this generally since . For example if has a Poisson distribution with parameter 200, then
which we computed using a computer simulation, and is thus larger than .
For which length of the increasing streak would we really be convinced that the system is not stationary? Under the assumption of no structural change three subsequent increasing values would occur with a probability of 0.04, four subsequent values 0.01 and five subsequent values with a probability of 0.001.
Most of us will agree that a probability of is so small it is very unlikely to observe five subsequent increasing counts while a trend is absent, and thus we would conclude that the system is changing. This way of reasoning is what we call hypothesis testing in statistics. You assume a world in which the system underlying the data did not change, and this is what we call our null hypothesis. Next we derive the probability of the observed event while assuming this null hypothesis is the truth. This probability is referred to as the p-value in statistics. For the increasing streak of different lengths, this probability has been presented throughout this article.
The major difficulty in statistics is that you cannot prove something could not happen under your null hypothesis. You can only conclude that something is extreme unlikely under your assumptions. The data analyst will judge whether something is too extreme. In social and medical sciences a default boundary probability of is used; if the observed event occurs with a probability less than , under your assumed null hypothesis, then we conclude that the null hypothesis cannot be true and thus prove that it is false. So, we say that if the p-value is less than , then we reject our null hypothesis.
But what does this now mean for the drugs dumping example? In the news, the four years of counts resulted in a streak of increases of length three. For the null hypothesis, the drugs-related crime did not change over these years, we found that the probability of the observed event equals . Following the reasoning of the social and medical scientists we would conclude that the null hypothesis, of constant drugs-related crime, is false and conclude “The number of dumpings of drug waste is increasing” and agree with the narrator (and my girlfriend) during the news item.
However, if we do not trust the 2014 count presented on television (159) and rely on the report of the police for this year (176) instead, then the increasing streak lasted only from 2015-2017. Only two increases in a row result in a p-value equal to 0.17 also discussed before. Since we cannot prove that our assumption on constant drugs-related crime is wrong and the conclusion drawn in the news is a bit hasty.
Now we entered 2019, I am looking forward to the news where the count of last year’s drugs dumping will be announced. Another increase (>207) would result for the different datasets in a streak of length four (p=0.01), respectively three (p=0.04). Both p-values would be less than 0.05 and me and my girlfriend, although regretting that the drugs-related crime is increasing, could watch the news in peace.
As soon as plastic waste ends up in water, it becomes increasingly difficult to clean up. That’s why it’s important to capture the waste closer to its source, in these canals and rivers. How can mathematical models be used to help clean plastic waste from canals and rivers?
The allocation of livers from organ donors to patients puts females at a disadvantage. A remedy was put into use in 2023, based on a common statistical model. This is expected to reduce sex disparity, but is not expected to solve the problem fully. Why? And what else can we do?
Rafael Prieto-Curiel is a mathematician and a faculty member at the Complexity Science Hub in Vienna, Austria. His research focuses on crime, mobility, migration and urban dynamics. We interviewed Rafael to learn about his story.
If, after reading the title, your immediate response is to shout "1/6-th", then you have correctly answered the question. Well done! However, in this article we will focus on the meaning of this question. What exactly is this "chance" of which you've just exclaimed it equals 1/6-th?


 .
. . Without going into the details of the mathematical derivations, the (1,1)-probability equals approximately 0.17. This is as likely as throwing a specific number with a fair dice and is therefore not enough proof to conclude that the system is not stationary.


 is so small it is very unlikely to observe five subsequent increasing counts while a trend is absent, and thus we would conclude that the system is changing. This way of reasoning is what we call hypothesis testing in statistics. You assume a world in which the system underlying the data did not change, and this is what we call our null hypothesis. Next we derive the probability of the observed event while assuming this null hypothesis is the truth. This probability is referred to as the p-value in statistics. For the increasing streak of different lengths, this probability has been presented throughout this article.
 is used; if the observed event occurs with a probability less than
  . Following the reasoning of the social and medical scientists we would conclude that the null hypothesis, of constant drugs-related crime, is false and conclude “The number of dumpings of drug waste is increasing” and agree with the narrator (and my girlfriend) during the news item.
 we cannot prove that our assumption on constant drugs-related crime is wrong and the conclusion drawn in the news is a bit hasty.