If you paid attention in history class you will know that war is never as straightforward as “good guys” versus “bad guys”. Any given conflict often has many players, each with their own motives and methods. For historians and social scientists to organise and interrelate all their stories is no easy task.
One way to organise it all is to describe it as a network. That is exactly what a group of researchers at Stanford University did with the "Mapping Militants Project". This project is funded by the US Department of Defence and the National Science Foundation through the Minerva Initiative, which spends some 75 million dollars on social science research involving military conflicts. The Stanford researchers took the many narratives of some of the biggest players in recent conflicts, and turned those into networks of time-lines.
Have a look at their network for Al-qaeda. At a glance it is immediately clear that Al-qaeda is not one organisation, but very many! And looking more closely we can see even more: the blue lines show if and when these organisations work together. From these you can see that it is not true that Al-qaeda is the clear boss here, as it sometimes seems from news stories. It is not even nearly the oldest. And notice those orange lines? Those indicate serious conflicts. So even though we might think that these groups are all on the same side, they sometimes aren’t. Conflicts are actually quite common in recent years, as we all know: tracing the orange lines you can clearly see how IS split itself from the network to become its own entity.
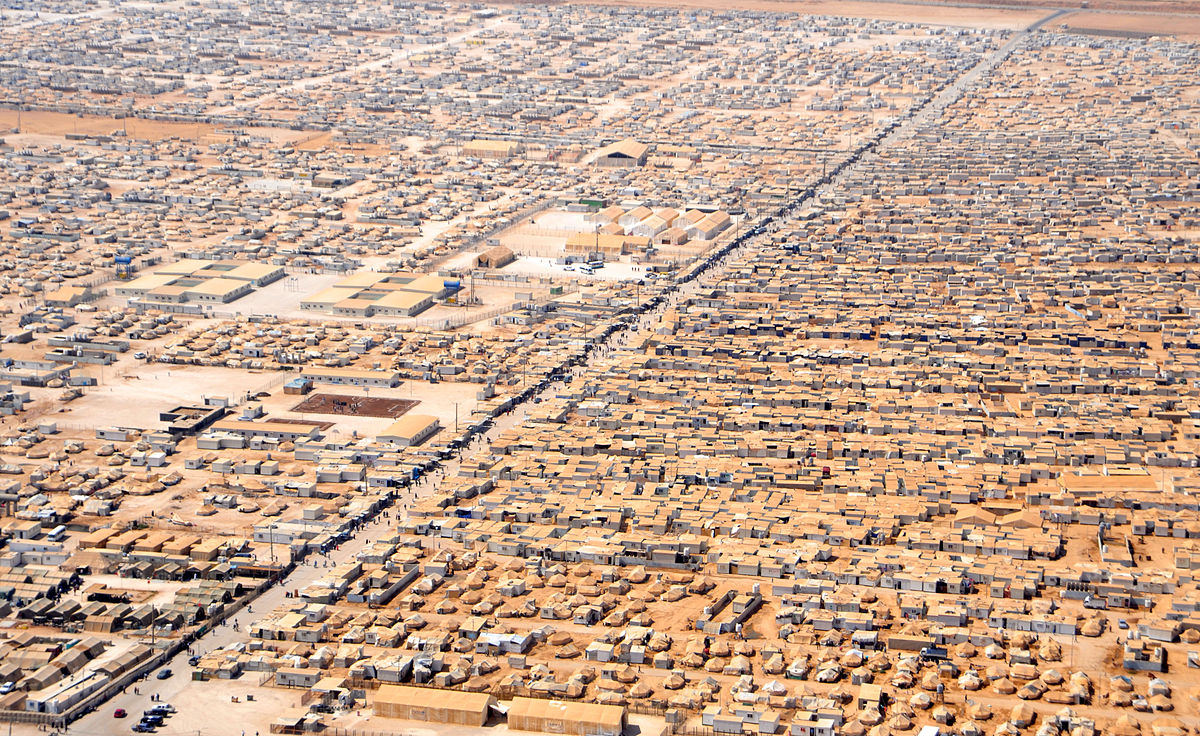
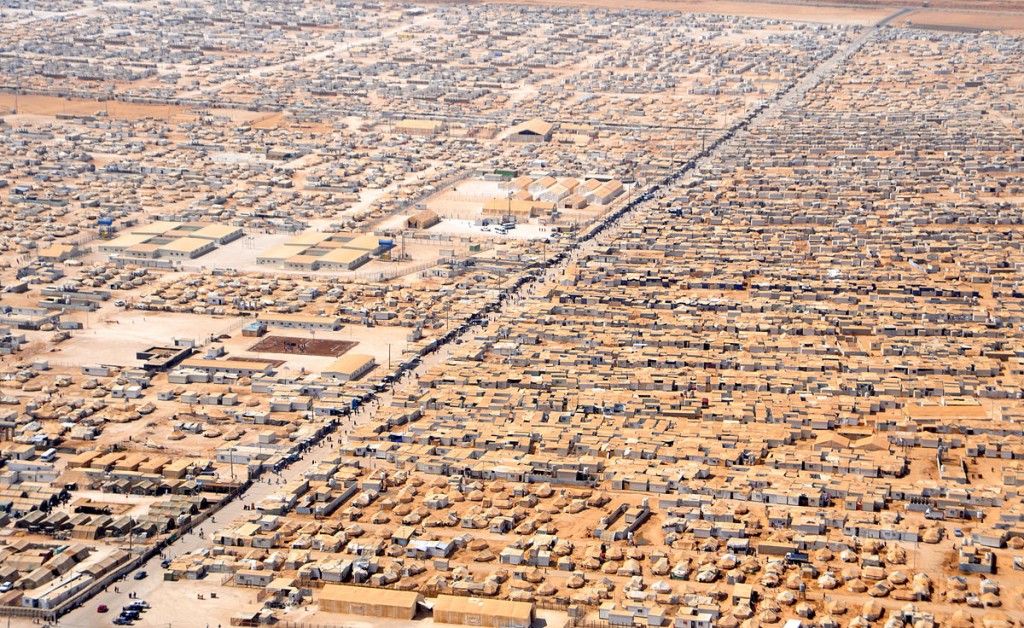
The Za'atri refugee camp [1]
Also have a look at this network of militant organisations in Italy from the 1950’s to the 1980’s. Note all the closed and broken black lines? Those lines indicate when groups merged and split, respectively. Try to follow, for instance, all the black lines going into and coming out of the “Red Brigades”. They split and merged seven times in less than 20 years!
So just spending a couple of minutes looking at these networks can give you a pretty good overview of extremely complicated conflicts. And with the right tools, training, and background, you would be able to tell even much more from studying these networks: You might be able to find similarities and differences between different conflicts, or possibly even predict how a group will react to a given event on the basis of the clustering and organisation of this pattern of lines. At least, that is what the Stanford scientists are hoping for.
But of course you should not imagine that these networks can tell us everything there is to know about the conflicts. They only give one angle on a hugely complex issue. The networks only tell us the structure, not the reasons for that structure. I don’t think networks will ever be able to explain what drove these people to take up weapons and fight.
"An Aerial View of the Za'atri Refugee Camp" by U.S. Department of State - http://www.flickr.com/photos/statephotos/9312291491/sizes/o/in/photostream/. Licensed under Public Domain via Commons - https://commons.wikimedia.org/wiki/File:An_Aerial_View_of_the_Za%27atri_Refugee_Camp.jpg#/media/File:An_Aerial_View_of_the_Za%27atri_Refugee_Camp.jpg
During our teenage years, everything changes. It’s no surprise that our brain does too. But how do we make sense of this transformation? Is there a way to quantify it? Networks might just be the answer.
We want our guts to be filled with a diverse range of mutually beneficial and competitive interactions, a perfect blend of friends, frenemies, and enemies to keep our guts active and body on its toes. Read how networks can help understand these interactions!