How do mathematics help fight Covid? Can numbers and sums be useful in containing a pandemic? Definitely! Because with mathematical models you simulate how a virus spreads in our country, and how to stop it.
The world came to a standstill in 2020 due to the corona pandemic. Many people did not expect a virus to disrupt our lives so much. Coincidentally, this was also the time when I defended my master's thesis (suddenly online) and started my PhD. The topic of my PhD is community detection, finding hidden groups in networks.

The beginning of the pandemic was an interesting time to enter the world of science. I saw that many colleagues were looking for ways to contribute to combating the crisis with their knowledge. Both my professors were also attempting to contribute, they asked me then if I wanted to help with a project to model the spread of the virus. The idea was to use mobility data (information about how people travel through the Netherlands) to predict how the virus will spread through the Netherlands.
Since I was already spending a large part of my time in those weeks refreshing nu.nl to see how the world was on fire, I thought it was a great opportunity to look deeper into the crisis and hopefully also contribute in some way. There was only one problem: I knew nothing about epidemiology. I hardly knew the difference between a virus and a bacteria. Fortunately, such biological details turned out to be unimportant in epidemiological models: models for the spread of a bacterium through a population can just as easily be used to model the spread of a virus.
Epidemiological models
Differences that do matter in such models are, for example, whether you remain immune permanently after an infection such as with measles (it was first thought/hoped that this would be the case with COVID), you are temporarily immune as with a cold, or whether you remain contagious for the rest of your life, like a possible zombie apocalypse.
In fact, the most commonly used epidemiological models are surprisingly simple: you simulate a number of 'puppets' and for every two puppets you take a certain probability that they will encounter each other one day. When an infectious puppet encounters a puppet that is susceptible to the virus, this second puppet becomes infected. The main difference between such models is how the probability that two puppets will encounter each other is determined. Is this the same for every two puppets or does it depend on the puppets?
Suppose you want to model the spread of a disease through a population of 101 puppets and you know that each puppet encounters on average 10 other puppets a day. Then the easiest way to do this is to calculate for every two puppets a 10% chance that they will meet since 10% of 101 minus 1 is indeed 10. But this model can also be made even more detailed. For example, if you also know how old the puppets are, you can adjust the model so that puppets of the same age meet more often than puppets of different ages.
But it is also possible to include many more details: for each puppet you can simulate a whole day's activity, whereby the chance of meeting depends, for example, on whether the two puppets were in the same supermarket at the same time. Early in the pandemic, for example, a well-known British epidemiologist published the results of such detailed simulations. The results of these simulations were so disturbing that the UK and US announced a lockdown shortly afterwards (see, for example, this article). The model used for this was created 15 years before the start of the pandemic to simulate a bird flu outbreak in Thailand. This just shows how you can use the same models for completely different diseases.
The model of the RIVM
While such detailed models certainly exist, more detailed models are not necessarily better. If you include more details in your model, you also need more data to 'calibrate' your model, so that the results of the simulations somewhat correspond to what happens in real life. For this reason, the model used by RIVM (the Dutch Institute of Public Health) during the pandemic is surprisingly simple: the chance of meeting only depends on the age of the two puppets. The number of puppets they put in each age group and how much the puppets in different age groups encounter each other are based on statistics and surveys that have been conducted in recent years.
This model therefore does not take into account where the puppets live and that puppets who live close by meet each other more often. Because these puppets do not have a 'hometown', you cannot see from the simulation how the virus is spreading through the country.
In the model we made, every puppet has a place of residence. We happened to have access to a dataset that allowed us to estimate how many people travelled between municipalities in the Netherlands on average in a day. In this way we made a model that made it possible to simulate how the virus spread across the Netherlands.
Travel Restrictions
The purpose of such models is to make predictions about how the epidemic (infections, hospitalizations) will develop under certain measures. You use these predictions to decide which measure makes the best trade-off between slowing the epidemic and having a negative impact on society. On the one hand, you have a complete lockdown, which considerably slows down the epidemic but also brings society and the economy to a standstill. On the other hand, there’s the option to simply do nothing, which keeps society fully open, but also lets the virus spread freely.
The type of measure we focused on was travel restrictions, whereby you divide the Netherlands into regions and people are allowed to move freely within their region, but not to visit other regions. Such measures are of course quite draconian, but at the beginning of the pandemic, draconian and creative measures were taken all over the world to fight the virus in the hope of avoiding a total lockdown.
Community detection
Another reason we chose this type of measure was that it was close to the subject of my PhD. You can see the mobility data as a network of municipalities in which the people who travel between the municipalities determine the strength of the connection between two municipalities. Dividing the country into such regions is then the same as finding groups in this network of municipalities, so community detection!
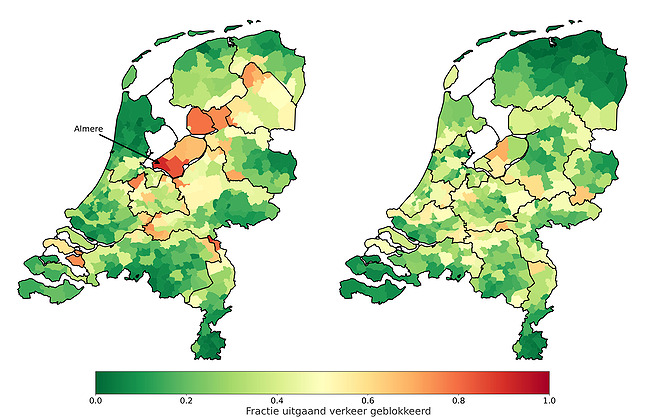
Dividing the Netherlands into its twelve provinces is of course the most obvious division, but this is not necessarily the best division: in the picture below, each municipality is colored based on the number of inhabitants who travel across the regional borders. If you live in a red-colored municipality, this division will disrupt normal traffic a lot. If you live in a green-colored municipality, you will only travel within your own region and you will not be hindered in your daily traffic by the restriction.
On the left you see the division into provinces. Take Almere, for example, where many people who live there leave the province of Flevoland on a daily basis (usually towards Amsterdam). If you divide the Netherlands into provinces, the residents of Almere suffer much more from these travel restrictions than the rest of the country.
The picture on the right is the result of a standard community detection algorithm on the mobility data. You can see that this division is different from the division into provinces: the northern provinces have been merged, Zeeland snacks a piece of Noord-Brabant and Almere is being added to the Amsterdam region. There is virtually no red on this map, which means that the impact of these travel restrictions is more fairly distributed across the country.
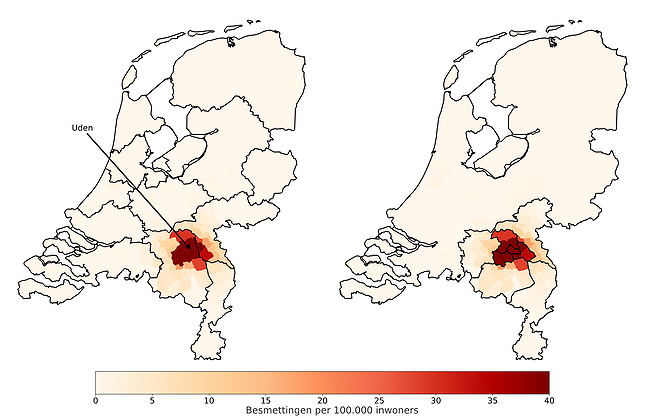
But this division does not yet take into account where the outbreak takes place: Limburg will also receive travel restrictions in the event that all infections take place in Groningen. To address this issue, we modified the community detection algorithm to account for the number of infections that our model would predict in each municipality. In the figure below we compare the division given by the above community detection algorithm with that given by our modified algorithm.
To determine this new division, we used our epidemiological model to simulate a COVID outbreak in Uden. The municipalities on the map are colored based on the number of infections according to this simulation.
You can see that the red spot in the left picture is on the border of two fairly large regions, while the rest of the country has virtually no infections, but is still divided into approximately equal sized regions. Conclusion: The travel restrictions in the two regions of the outbreak are actually not severe enough, while they are unnecessarily severe in the rest of the country.
On the right, you can see that the regions close to the breakout are very small and the regions further away from the breakout are larger. So this means that travel restrictions will be stricter as the outbreak gets closer. Sounds reasonable, right?
Pandemic solved?
Now you may wonder whether our research actually had an impact on policy during the epidemic? Well, if the Netherlands had been chopped into pieces, you would of course have noticed that. It is very rare that one study ensures a complete turnaround in corona policy. At the beginning of the study, we sometimes joked that we would “solve that pandemic” as if it were a mathematical equation. In practice, a model only takes into account a limited number of aspects from reality, so that you can only use it to answer a few questions.
In our model, we took the Dutch geography into account by distinguishing between different municipalities. For example, we simulated how an outbreak would spread across the country. In addition, we looked at what would happen with local travel restrictions, for example by splitting off a region from the rest of the country. The RIVM model, which only distinguishes between different age groups, did not answer these questions. That model simulated how the virus would spread across the different age groups. The latter is, for example, very important to predict the number of intensive care admissions.
Corona is difficult to capture in a model. Instead of focusing on one complicated and very detailed model, it is therefore important to look at several models. This is how you model those different realistic aspects. In this way we will hopefully get a better grip on a (Covid) pandemic in the future.
This article is a translation of Martijn's original blog post written for Faces of Science.